Requirements & scope
Problem Statement & Requirements
Design a ride-sharing platform that matches riders with nearby drivers in real-time, handles the full trip lifecycle from request to payment, and provides live location tracking — similar to Uber, Lyft, Grab, or DiDi.
Functional Requirements
- Request a ride — rider enters pickup and dropoff locations; system shows ETA and fare estimate
- Match rider to driver — find the optimal nearby driver based on proximity, ETA, and driver rating
- Real-time location tracking — both rider and driver see each other's live position on a map during the trip
- Trip lifecycle — request → match → driver en route → pickup → in-trip → dropoff → payment → rating
- Fare calculation — based on distance, time, base fare, surge multiplier, tolls
- Surge pricing — dynamic pricing based on supply/demand ratio in a geographic area
- Driver availability management — drivers go online/offline; system tracks who is available and where
- Ride types — UberX, UberXL, Black, Pool (shared rides), etc.
- Payment — charge rider, pay driver; support cards, wallets, cash
- Ratings — mutual ratings (rider rates driver, driver rates rider)
- Trip history — riders and drivers can view past trips
- ETA estimation — estimated time of arrival for both pickup and dropoff
Non-Functional Requirements
- Low latency matching — rider matched to driver within < 5 seconds
- Real-time location updates — position updates every 3-4 seconds from all active drivers
- High availability — 99.99% for ride requests (core revenue path)
- Scalability — 500K concurrent drivers, 1M+ concurrent rides
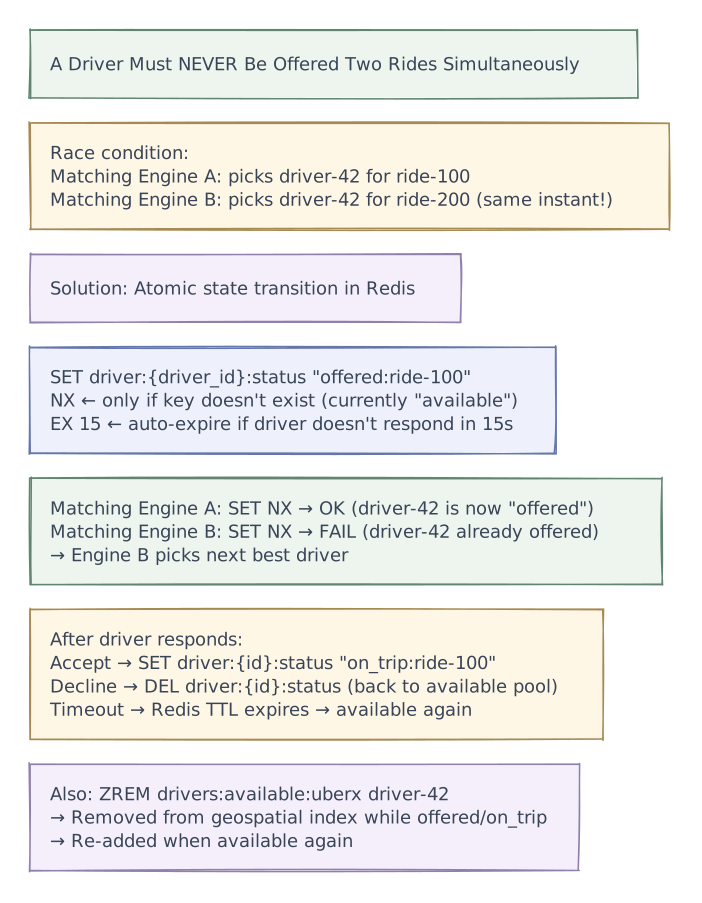
- Consistency — a driver must NEVER be matched to two riders simultaneously
- Geographic coverage — operate in 10,000+ cities across 70+ countries
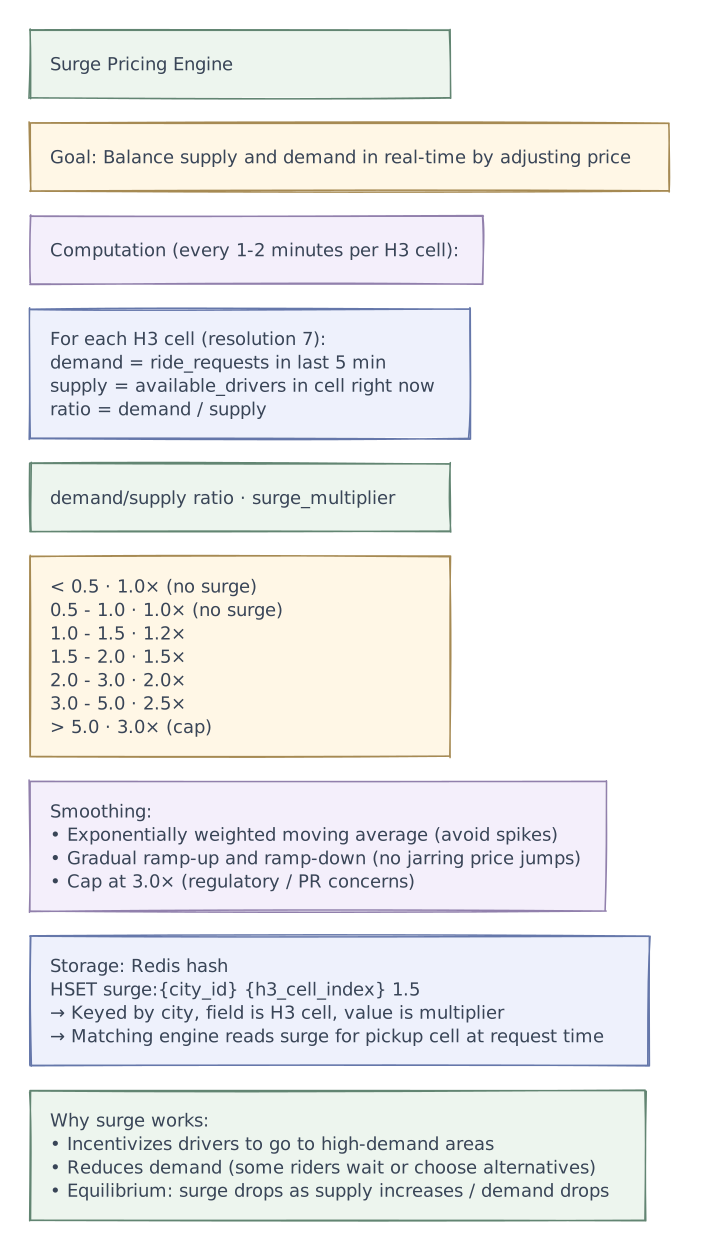
- Surge responsiveness — pricing adjusts within 1-2 minutes of supply/demand shift
Out of Scope
- Uber Eats / delivery platform
- Autonomous vehicle integration
- Driver onboarding / background checks
- Detailed mapping / routing engine internals (use Google Maps / OSRM)
Scale estimations
Scale Estimations
Traffic
| Metric | Value |
|---|---|
| Active drivers (online) at any time | 500K |
| Concurrent active rides | 1M |
| Ride requests / day | 20M |
| Ride requests / second (avg) | ~230 RPS |
| Ride requests / second (peak — NYE, rush hour) | ~2,000 RPS |
| Driver location updates / second | 500K drivers × 1 update/4s = 125K updates/sec |
| Rider location queries (tracking screen) / second | 1M rides × 1 query/3s = ~333K RPS |
Storage
| Metric | Value |
|---|---|
| Trip record | 3 KB (locations, timestamps, fare, route) |
| Trips per year | 20M/day × 365 = ~7.3B |
| Trip storage per year | 7.3B × 3 KB = ~22 TB |
| Location history (GPS breadcrumbs per trip) | avg 200 points × 30 bytes = 6 KB/trip |
| Location history per year | 7.3B × 6 KB = ~44 TB |
| Driver profiles | 5M × 2 KB = ~10 GB |
| Rider profiles | 100M × 2 KB = ~200 GB |
Bandwidth
| Metric | Value |
|---|---|
| Location ingestion (125K/s × 100 bytes) | ~12.5 MB/s |
| Location queries (333K/s × 200 bytes) | ~67 MB/s |
| API responses (ride request, trip updates) | ~50 MB/s |
| Total bandwidth | ~130 MB/s |
Hardware Estimate
| Component | Spec |
|---|---|
| API servers | 50-100 (stateless, auto-scaling) |
| Location service | 20-50 (high write throughput) |
| Matching service | 10-20 (compute-heavy, latency-critical) |
| Trip service | 20-40 |
| Geospatial DB / index | 20-50 nodes (Redis + geospatial index) |
| Trip database | 20-30 shards (PostgreSQL) |
| Kafka (event streaming) | 10-20 brokers |
| WebSocket / push servers | 50-100 (1.5M concurrent connections) |
Layered architecture
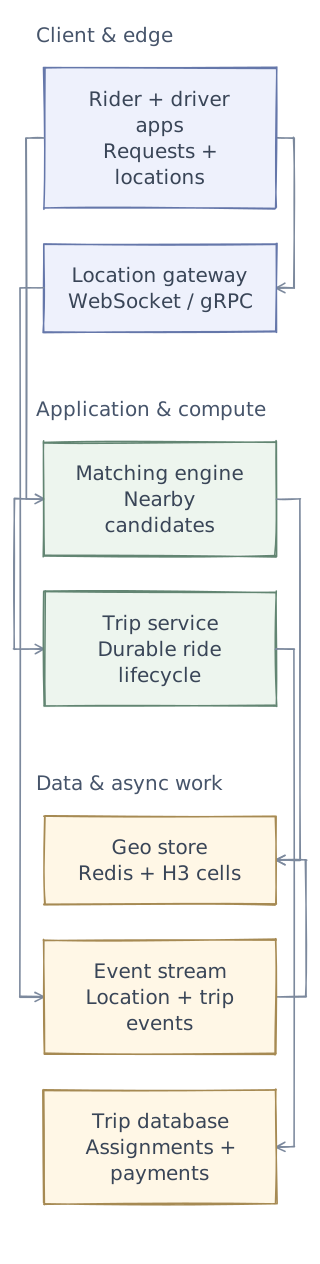
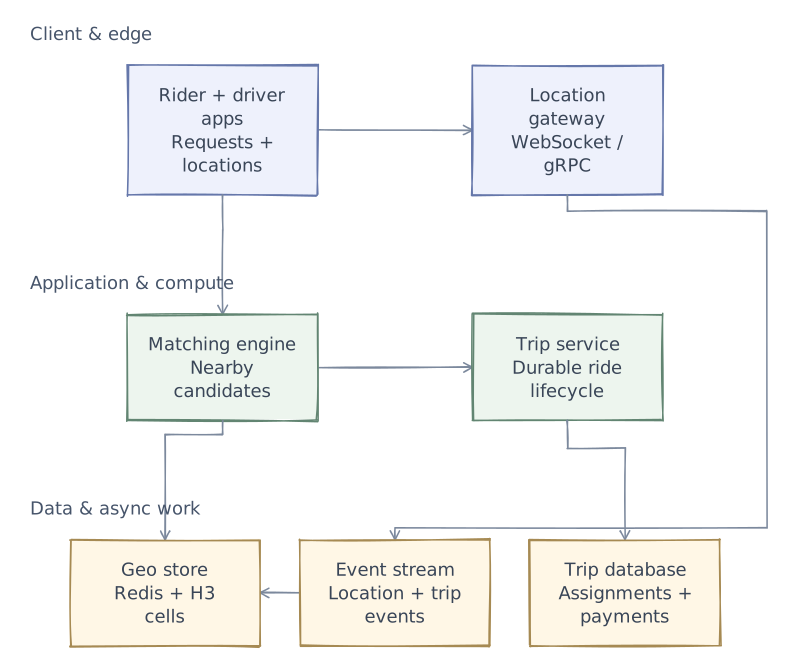
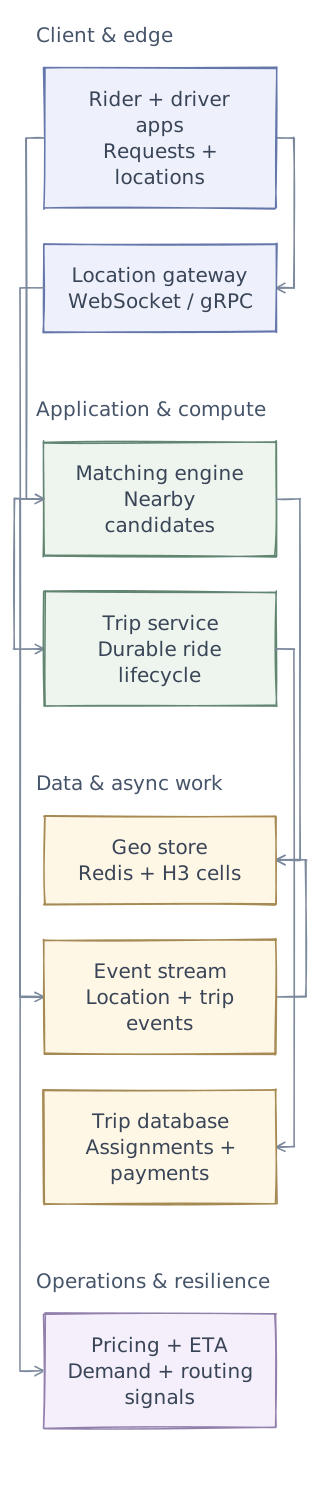
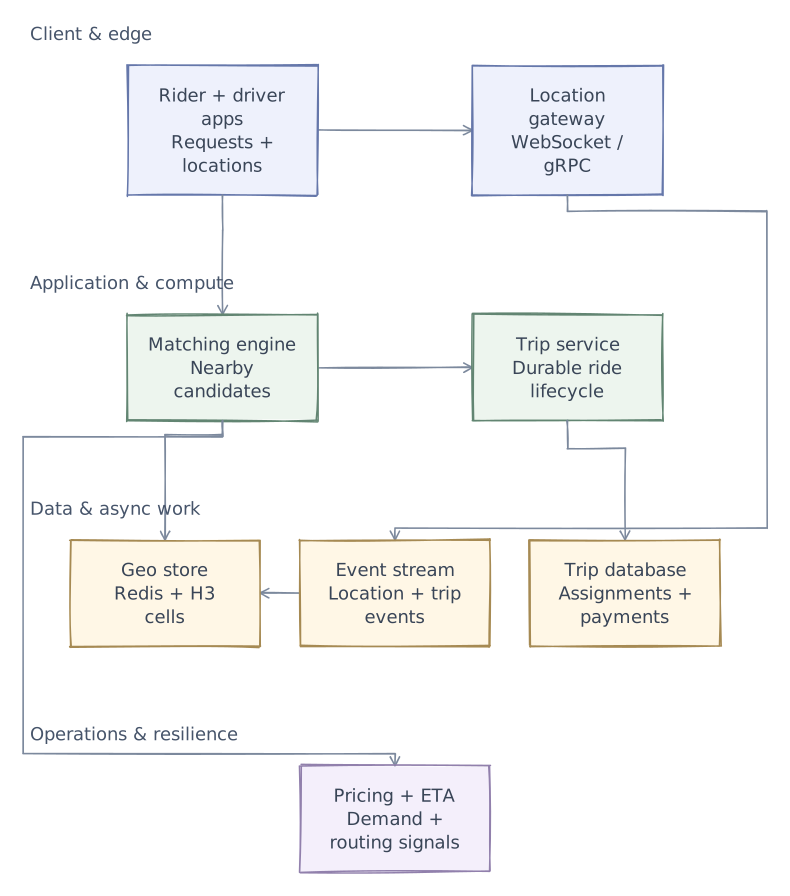
Phase 1 of 4 · Client & edge
Start with the entry points
First, define who uses the system and where requests enter. This is the boundary of the design, not yet a complete request path.
- Rider + driver apps
- Stream driver location and allow riders to request a trip with a pickup and destination.
- Location gateway
- Ingest frequent location updates with timestamps and discard outdated positions.
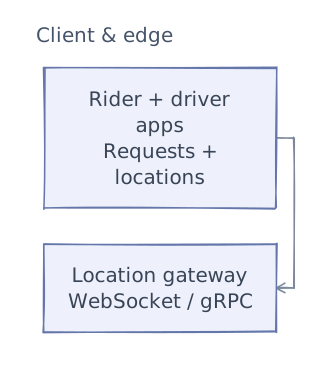
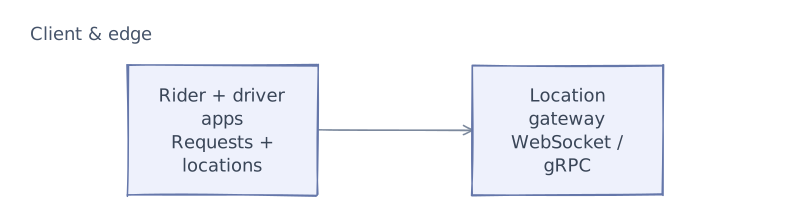
This first layer defines the system boundary. The next chapters add application logic and data dependencies. After examining the request paths and tradeoffs, we will add operational safeguards and bring the complete architecture together.
API & contracts
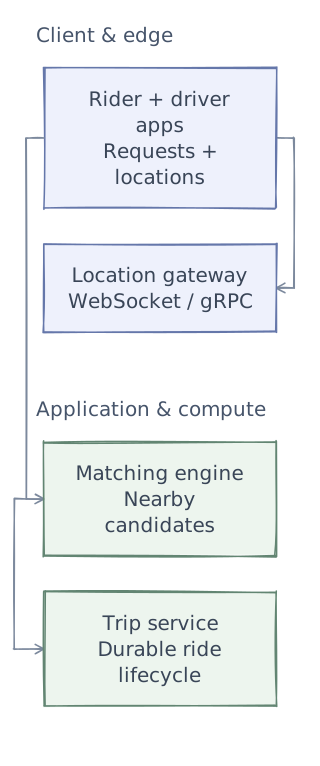
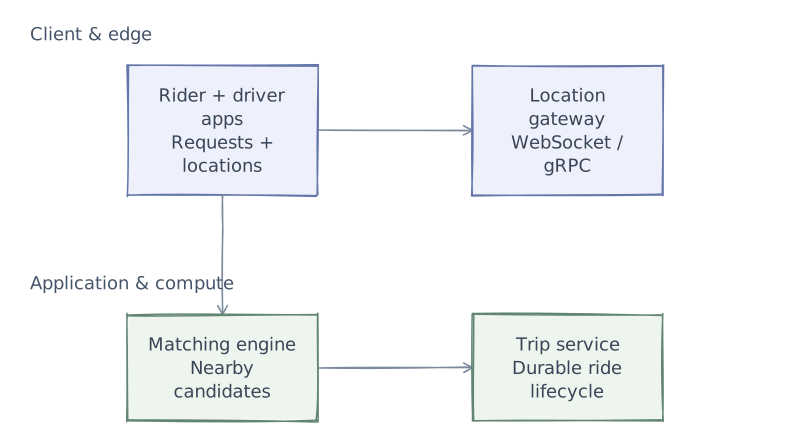
Phase 2 of 4 · Application & compute
Add the application logic
Keep the entry points and add the services that do the work. Give each service a clear responsibility before defining its contracts. Storage and background dependencies come next.
- Matching engine
- Query nearby available drivers, rank offers, and use explicit acceptance timeouts.
- Trip service
- Manage requested, accepted, started, and completed states with conditional transitions.
API Design
Request a Ride
POST /api/v1/rides/request
Authorization: Bearer <rider_token>

Request:
{
  "pickup": {"lat": 40.7484, "lng": -73.9857},       // Empire State Building
  "dropoff": {"lat": 40.7580, "lng": -73.9855},      // Times Square
  "ride_type": "uberx",
  "payment_method_id": "pm_card_4242",
  "passenger_count": 2
}

Response (200 OK):
{
  "ride_id": "ride-abc123",
  "status": "matching",
  "fare_estimate": {
    "min": 1200,               // cents
    "max": 1600,
    "currency": "usd",
    "surge_multiplier": 1.0,
    "breakdown": {
      "base_fare": 250,
      "distance_charge": 680,  // $0.85/mile × 0.8 miles
      "time_charge": 270,      // $0.25/min × ~10.8 min
      "booking_fee": 200
    }
  },
  "pickup_eta_seconds": 180,    // driver arrives in ~3 min
  "dropoff_eta_seconds": 780    // total trip ~13 min
}

// Client opens WebSocket for real-time updates:
// ws://api.example.com/ws/rides/ride-abc123
Driver Location Update (High-Frequency)
// Sent via WebSocket or gRPC stream (not REST — too much overhead)

Message (every 3-4 seconds from driver app):
{
  "driver_id": "drv-xyz789",
  "lat": 40.7500,
  "lng": -73.9860,
  "heading": 45,                // degrees (0=north)
  "speed_mph": 22,
  "timestamp": 1712150400123,   // ms precision
  "trip_id": "ride-abc123",     // null if not on active trip
  "availability": "available"   // available | on_trip | offline
}
Driver Accepts/Declines Ride Offer
POST /api/v1/rides/{ride_id}/respond
Authorization: Bearer <driver_token>

Request:
{
  "action": "accept"            // accept | decline
}

Response (200 OK):
{
  "ride_id": "ride-abc123",
  "status": "driver_en_route",
  "rider": {
    "name": "Alice",
    "rating": 4.9,
    "pickup": {"lat": 40.7484, "lng": -73.9857, "address": "350 5th Ave"}
  },
  "navigation_url": "https://maps.example.com/route?to=40.7484,-73.9857"
}
Trip Status Updates (WebSocket Push)
// WebSocket messages pushed to both rider and driver apps:

// Driver matched:
{"type": "driver_matched", "driver": {"name": "Bob", "rating": 4.85,
 "vehicle": {"make": "Toyota", "model": "Camry", "plate": "ABC 1234"},
 "eta_seconds": 180, "location": {"lat": 40.7520, "lng": -73.9870}}}

// Driver location update (every 3-4s while en route):
{"type": "driver_location", "lat": 40.7505, "lng": -73.9862,
 "eta_seconds": 120, "heading": 195}

// Driver arrived at pickup:
{"type": "driver_arrived", "message": "Your driver has arrived"}

// Trip started:
{"type": "trip_started", "at": "2026-04-03T10:05:00Z"}

// Trip completed:
{"type": "trip_completed",
 "fare": {"total": 1435, "currency": "usd", "breakdown": {...}},
 "dropoff_at": "2026-04-03T10:18:30Z",
"prompt_rating": true}Data model
Phase 3 of 4 · Data & async work
Connect data and background work
The services now need their dependencies: durable state, fast lookups, or work that continues outside a request. Separate these responsibilities rather than treating every component as a database.
- Geo store
- Index current driver location by spatial cell and expire stale availability.
- Event stream
- Decouple location ingestion from index updates and downstream analytics.
- Trip database
- Prevent conflicting driver assignments and persist the trip's authoritative state.
Data Model
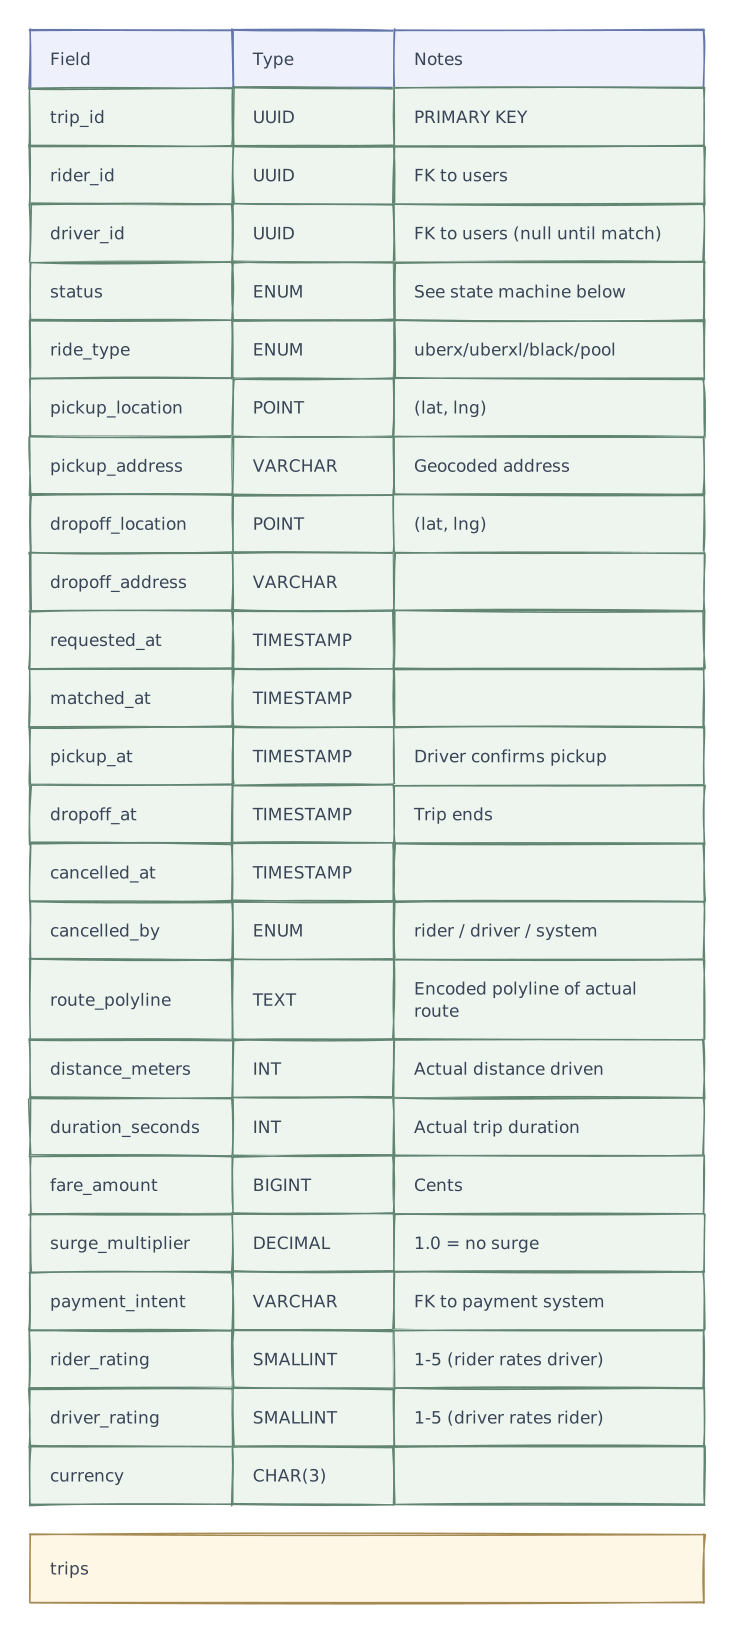
Trip Record

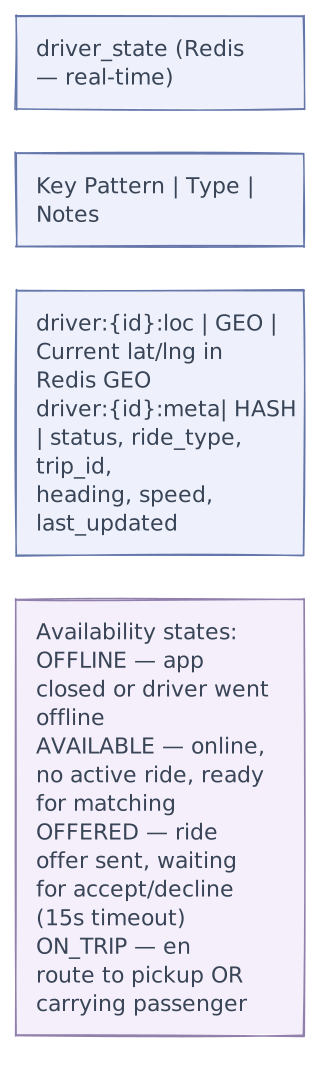
Driver State
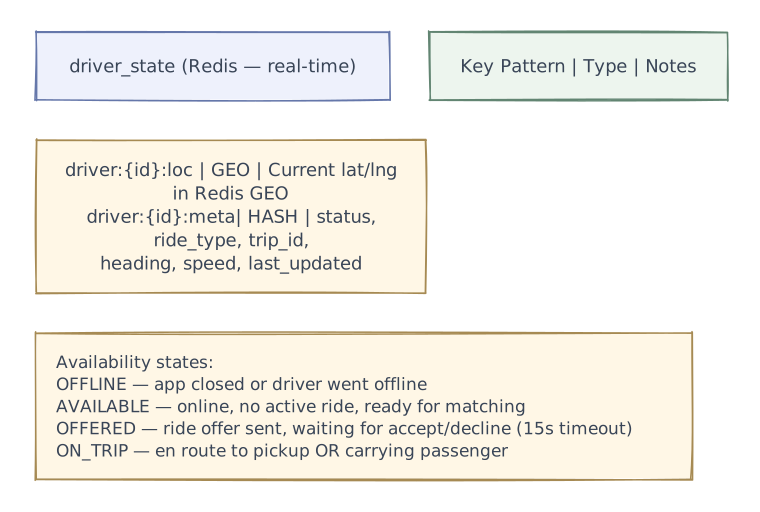
Trip State Machine

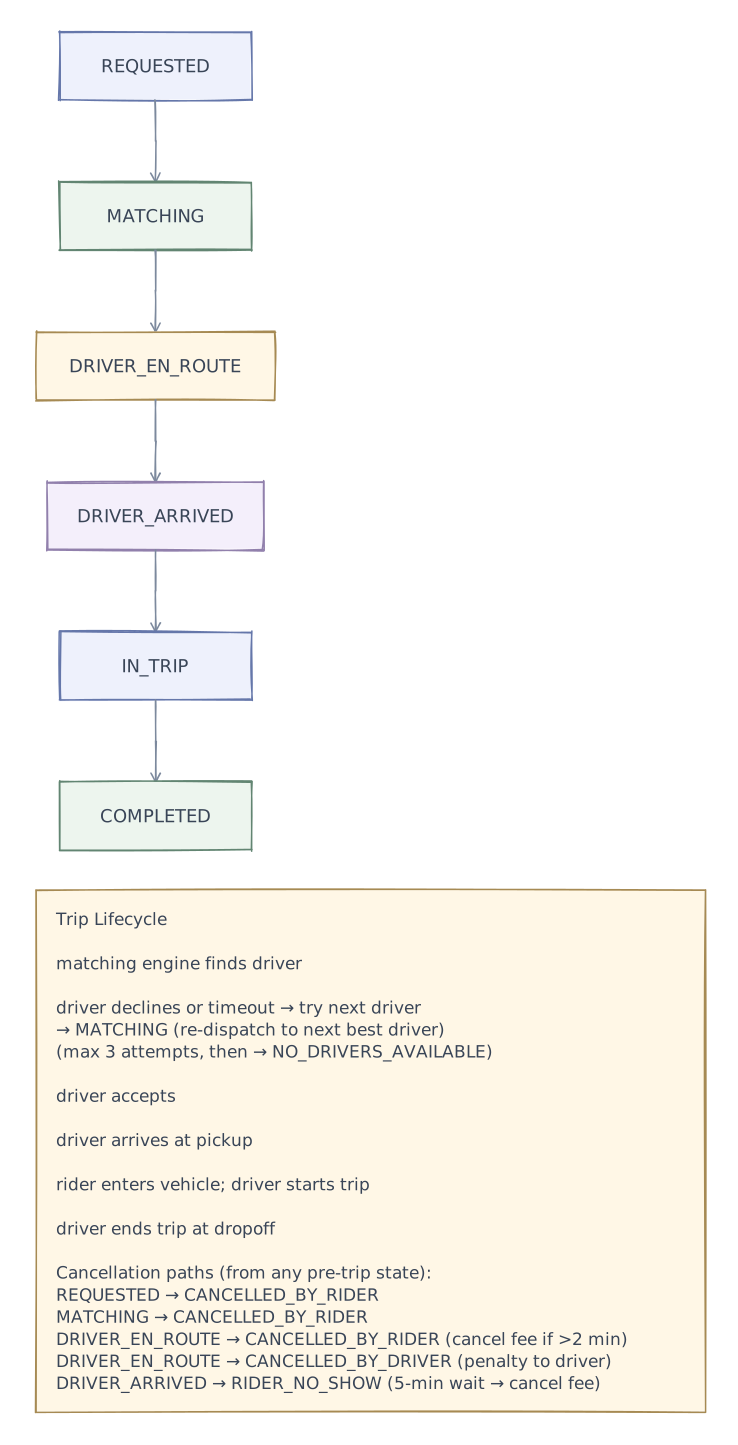
Core design decisions
Core Design Decisions
Decision 1: Geospatial Indexing — How to Find Nearby Drivers Fast
This is the most performance-critical operation. Every ride request needs nearby drivers in < 100 ms.
Option A: PostGIS (PostgreSQL + Spatial Index)
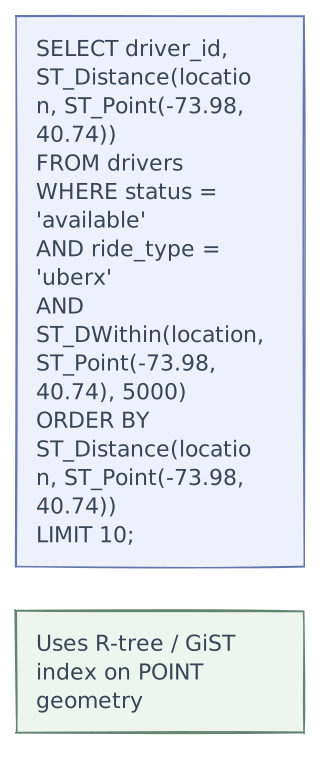
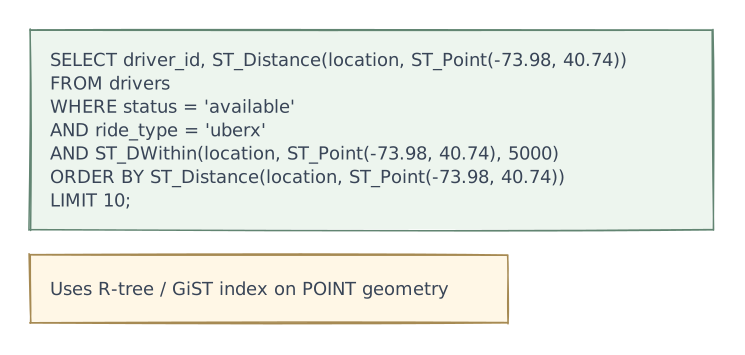
| Pros | Cons |
|---|---|
| Rich spatial queries (within polygon, etc.) | Not designed for 125K writes/sec |
| ACID transactions | Read latency ~10-50 ms (good, not great) |
| Familiar SQL | Doesn't scale horizontally easily |
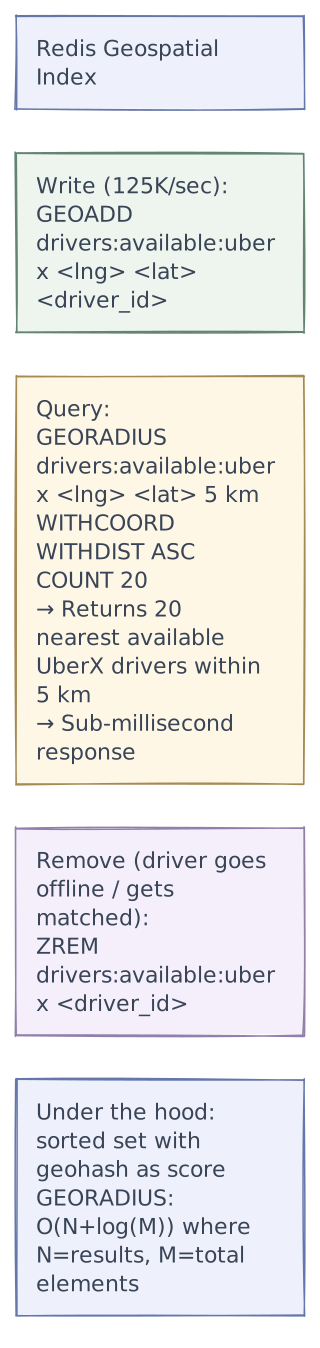
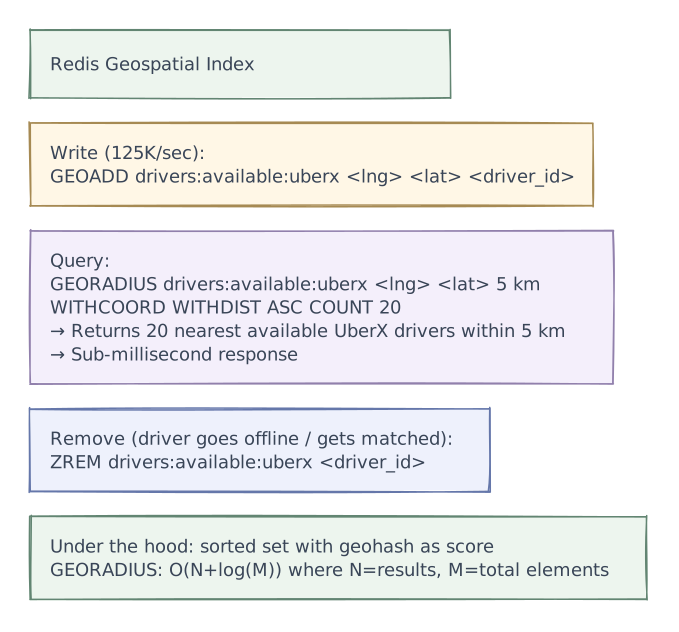
Option B: Redis GEO Commands
| Pros | Cons |
|---|---|
| Sub-ms reads — perfect for matching | No complex spatial queries (no polygons) |
| Handles 125K writes/sec easily | In-memory — needs persistence strategy |
| Built-in radius search | Radius only (not arbitrary shapes) |
| Simple API | Sharding by city/region needed at scale |
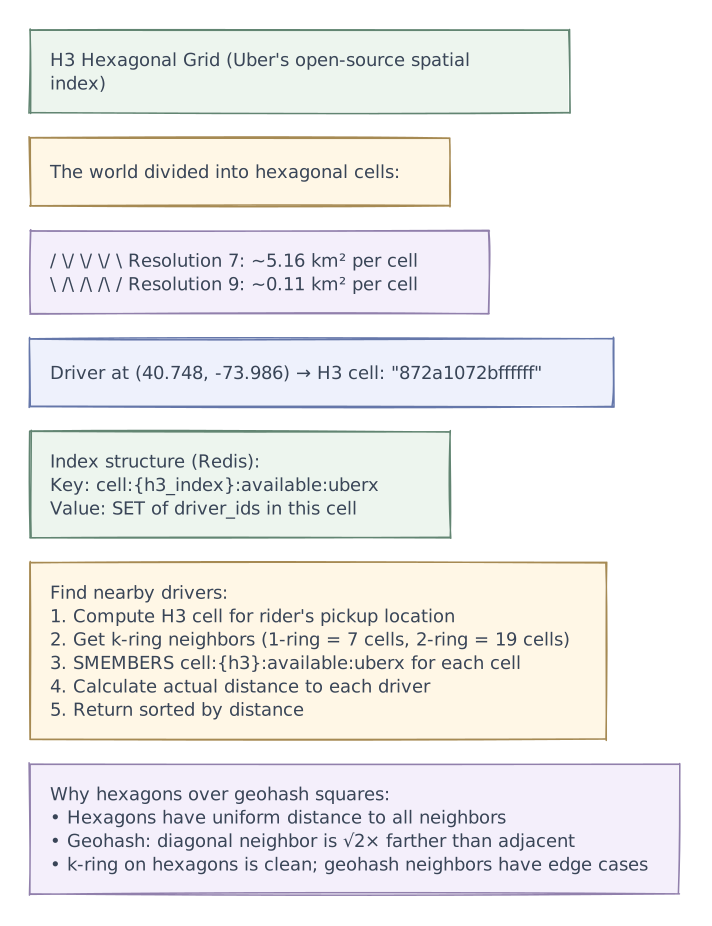
Option C: H3 Hexagonal Grid + Redis (Uber's Approach)

| Pros | Cons |
|---|---|
| Uniform spatial cells (no distortion) | More complex than Redis GEO |
| Perfect for supply/demand per cell (surge) | Requires H3 library integration |
| Uber-proven at massive scale | Cell resolution choice matters |
| k-ring gives predictable neighbor expansion |
Recommendation: H3 Grid + Redis
Use H3 for cell-based operations (surge pricing, supply/demand per area).
Use Redis GEO for precise nearest-driver queries within cells.
Both updated from the same location stream (Kafka consumer).
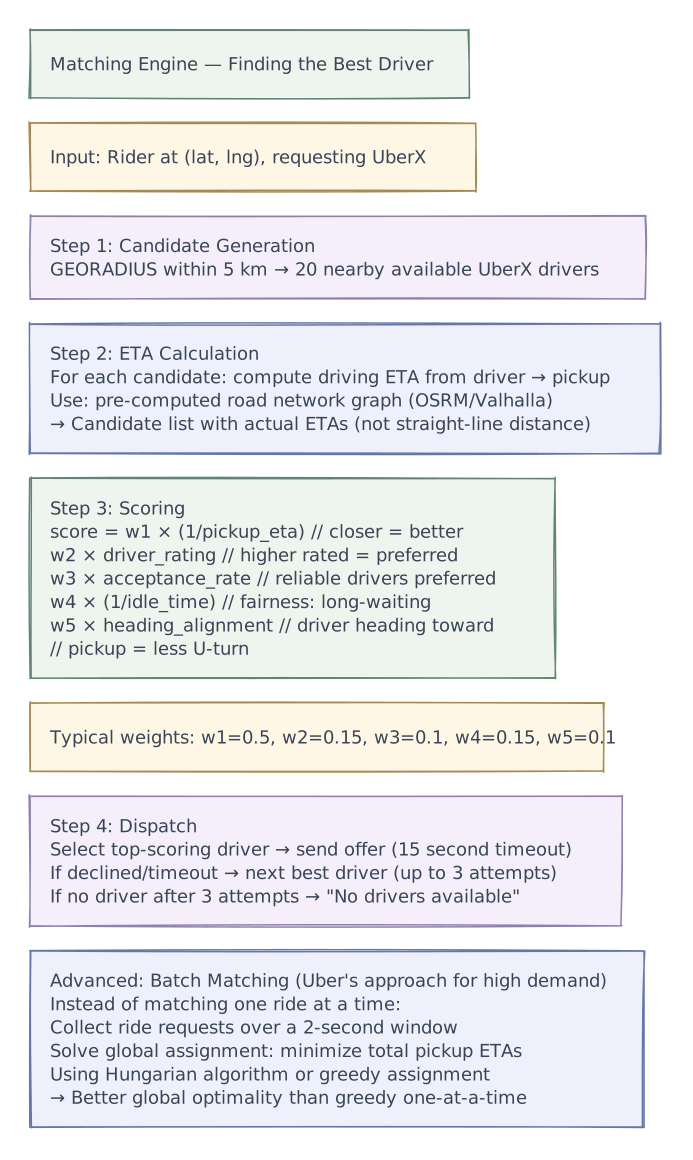
Decision 2: Matching Algorithm — Driver Selection

Decision 3: Preventing Double-Dispatch

Request flows
Detailed Flow Diagrams
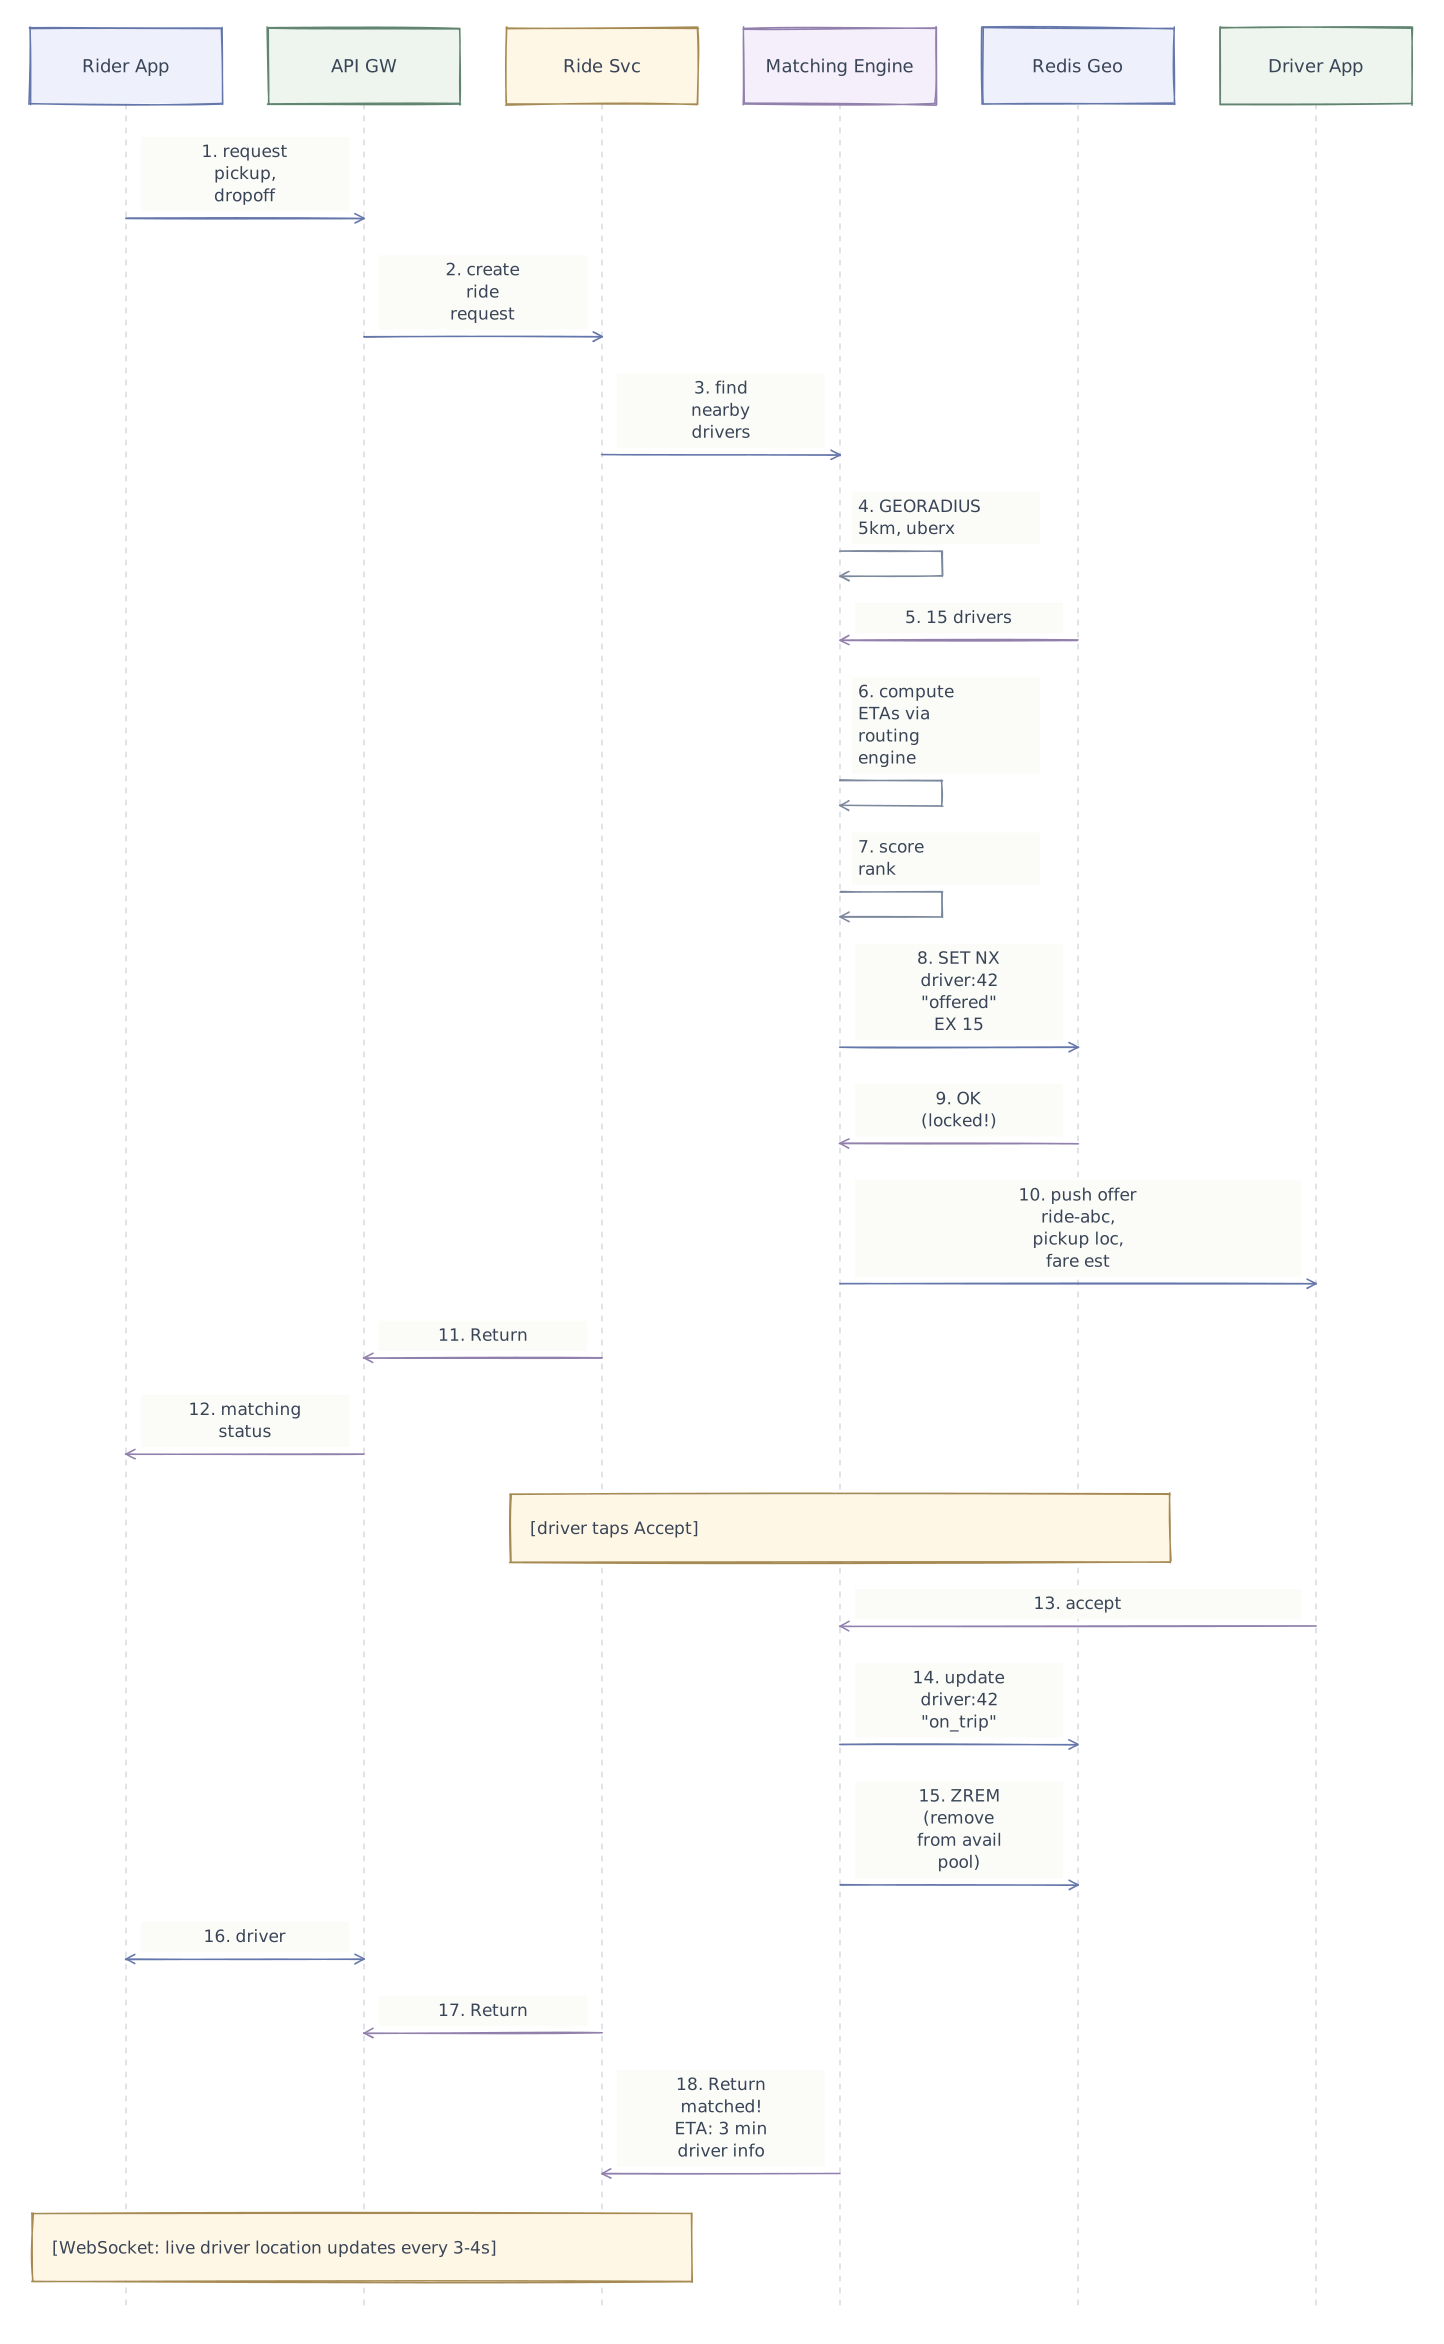
Ride Request → Match → Trip Flow

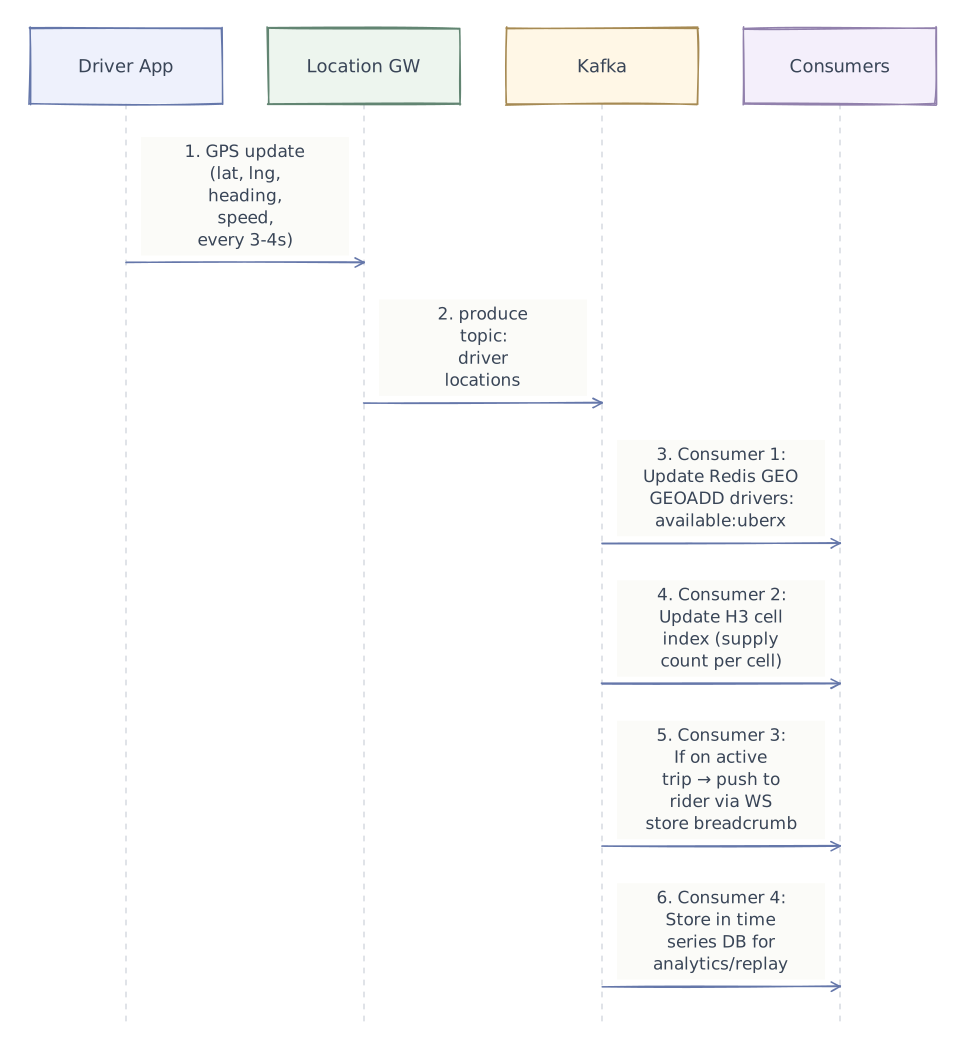
Location Ingestion Pipeline

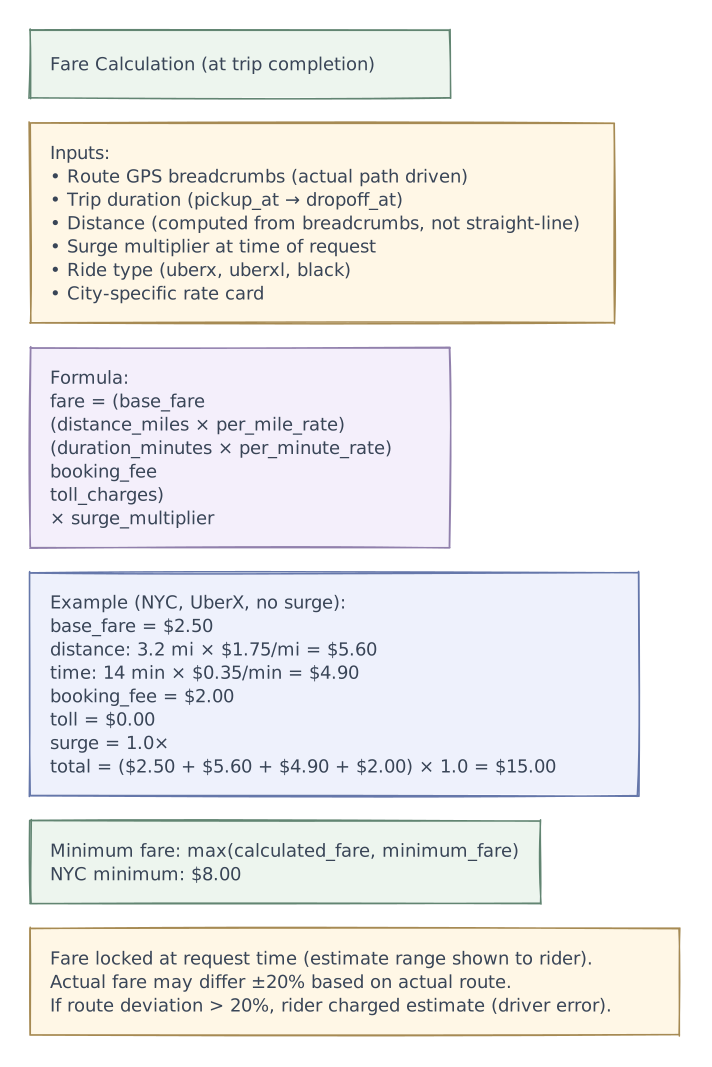
Fare Calculation Flow

Performance & caching
Location updates are frequent and quickly become stale. Coalesce updates and keep only the freshest useful position in the nearby-driver serving path, while retaining trip-critical events durably. Match from a bounded candidate set and measure estimated arrival time; geometric distance alone can choose a driver on the wrong side of a river.
Advanced design
Surge Pricing

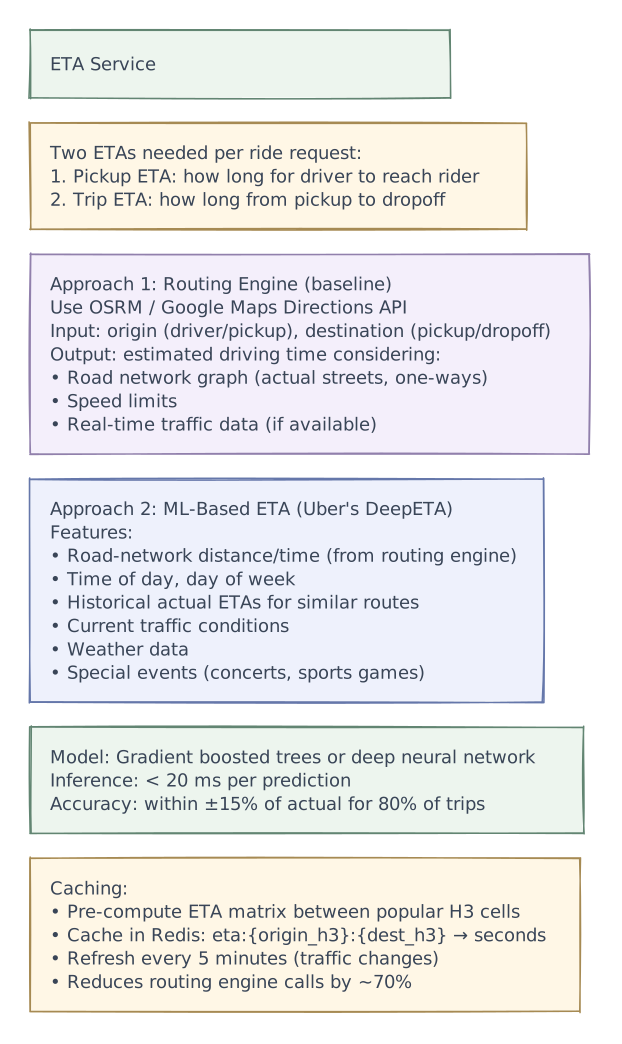
ETA Estimation

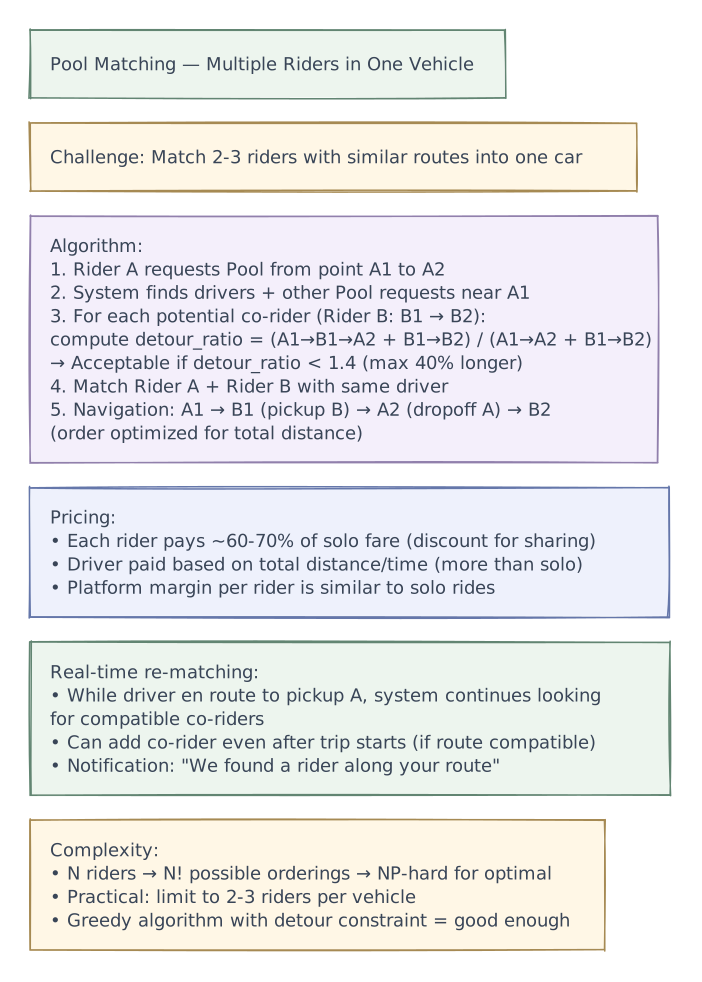
Shared Rides (UberPool / Lyft Shared)

Edge cases
Handling Edge Cases
Driver Goes Offline Mid-Trip
Problem: Driver's app crashes or phone dies during active trip

Detection:
  No location update for > 60 seconds (normally every 3-4s)

Response:
  1. Flag trip as "driver_unreachable"
  2. Attempt push notification / SMS to driver
  3. After 5 minutes no response:
     → Contact rider: "We've lost contact with your driver"
     → Offer: cancel with full refund, or wait
  4. Calculate fare based on last known position
     → Charge for distance/time up to disconnect point
  5. Rider gets free cancellation + credit for inconvenience
Rider No-Show
Driver arrives at pickup → starts 5-minute wait timer

  T+0:   Driver arrives, rider notified
  T+2m:  Reminder notification to rider
  T+5m:  Timer expires
         → Trip auto-cancelled as "rider_no_show"
         → Rider charged cancellation fee ($5-10)
         → Driver compensated for wait time
         → Driver returns to available pool
Route Manipulation (Fraud)
Problem: Driver takes a longer route to inflate fare

Detection:
  1. Compare actual route distance with optimal route distance
     ratio = actual_distance / optimal_distance
     If ratio > 1.3 (30% longer):
       → Flag for review

  2. Real-time monitoring: if driver deviates significantly
     from navigation route → alert rider in app

Response:
  → Charge rider the ESTIMATED fare (based on optimal route)
  → Deduct excess from driver's payout
  → Repeated offenses → driver deactivation
Concurrent Ride Requests in Same Area
Problem: 100 riders request UberX in Times Square simultaneously
         Only 30 drivers available

Solution: Batch matching (2-second windows)

  T+0.0s: Ride requests R1-R100 arrive
  T+2.0s: Matching engine collects batch

  Assignment problem (bipartite matching):
  Riders: [R1, R2, ..., R100]
  Drivers: [D1, D2, ..., D30]

  Objective: Minimize total pickup ETA across all matches
  Algorithm: Hungarian algorithm or greedy with re-optimization

  Result:
  → 30 riders matched to optimal drivers
  → 70 riders: "Looking for drivers" (retry in 10s)
  → Surge pricing kicks in (demand >> supply) → attracts more drivers
Payment Failure After Trip
Problem: Trip completes but rider's card declines

  1. Attempt charge → card declined
  2. Retry with backup payment method (if on file)
  3. If no backup: rider's account flagged
     → Must add valid payment before next ride
  4. Driver paid regardless (platform absorbs the loss temporarily)
  5. Rider charged on next successful payment method addition
6. Repeated payment failures → account suspensionTradeoffs
Tradeoffs & Design Decisions Summary
| Decision | Option A | Option B | Chosen | Why |
|---|---|---|---|---|
| Geospatial index | PostGIS | Redis GEO + H3 | Redis GEO + H3 | Sub-ms reads, handles 125K writes/sec; H3 for surge pricing per cell |
| Location transport | REST API | WebSocket / gRPC stream | WebSocket | REST overhead too high for 125K/sec; persistent connection efficient |
| Location pipeline | Direct to DB | Kafka → consumers | Kafka | Decouples ingestion from processing; multiple consumers (geo index, tracking, analytics) |
| Matching | Greedy (one-at-a-time) | Batch (2s windows) | Batch for high demand, greedy for low | Batch optimizes global pickup ETAs during peak; greedy sufficient when supply > demand |
| Double-dispatch prevention | DB row lock | Redis SET NX EX | Redis SET NX | Atomic, fast, auto-expires; no lock contention; same pattern as ticket booking holds |
| Driver offer timeout | 30 seconds | 15 seconds | 15 seconds | Shorter timeout = faster re-dispatch; drivers who hesitate likely decline anyway |
| Surge calculation | Real-time per-request | Periodic (1-2 min) | Periodic | Per-request is too expensive; 1-2 min lag acceptable; smoothing prevents spikes |
| ETA | Routing engine only | ML model + routing | ML + routing | ML captures historical patterns + traffic + weather; 15% more accurate than routing alone |
| Trip fare | Pre-computed fixed | Distance + time (actual) | Actual | Fairer; rider sees estimate range upfront; actual charged within bounds |
| Communication | Polling | WebSocket push | WebSocket | Real-time location updates every 3-4s; polling wastes bandwidth and adds latency |
Reliability & fault tolerance
Phase 4 of 4 · Operations & resilience
Add operational safeguards
With the request paths and tradeoffs established, add the controls that help detect trouble and keep the system operating. The final diagram retains every layer introduced so far.
- Pricing + ETA
- Estimate arrival and fare with freshness-aware inputs and graceful fallbacks.
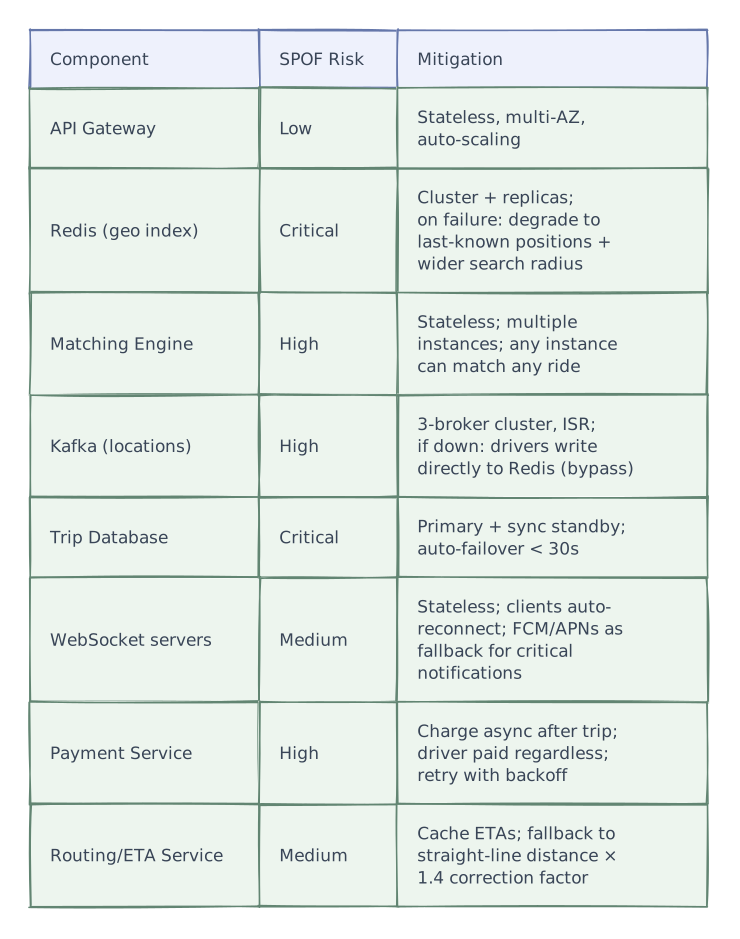
Reliability & Fault Tolerance
Single Points of Failure & Mitigations

Graceful Degradation
Tier 1 (ETA service down):
  → Use cached ETA matrix between H3 cells
  → Fallback: straight-line distance × 1.4 / avg_speed
  → Less accurate but ride request still works

Tier 2 (Surge pricing down):
  → Default to 1.0× (no surge) for all areas
  → Rides work, just no dynamic pricing
  → Driver incentive temporarily lost

Tier 3 (Kafka location pipeline down):
  → Drivers write location directly to Redis (bypass Kafka)
  → Lose analytics/breadcrumbs temporarily
  → Matching continues with live positions

Tier 4 (Redis geo index down):
  → Fall back to PostGIS queries (slower, ~50 ms)
  → Matching still works, just higher latency
  → Reduce candidate pool size to compensate

Tier 5 (Trip DB shard down):
  → Active trips on that shard: tracked in memory/Redis
  → New rides on other shards continue normally
  → Failover to standby (< 30s)
→ In-flight trips recovered from Redis stateProduction architecture
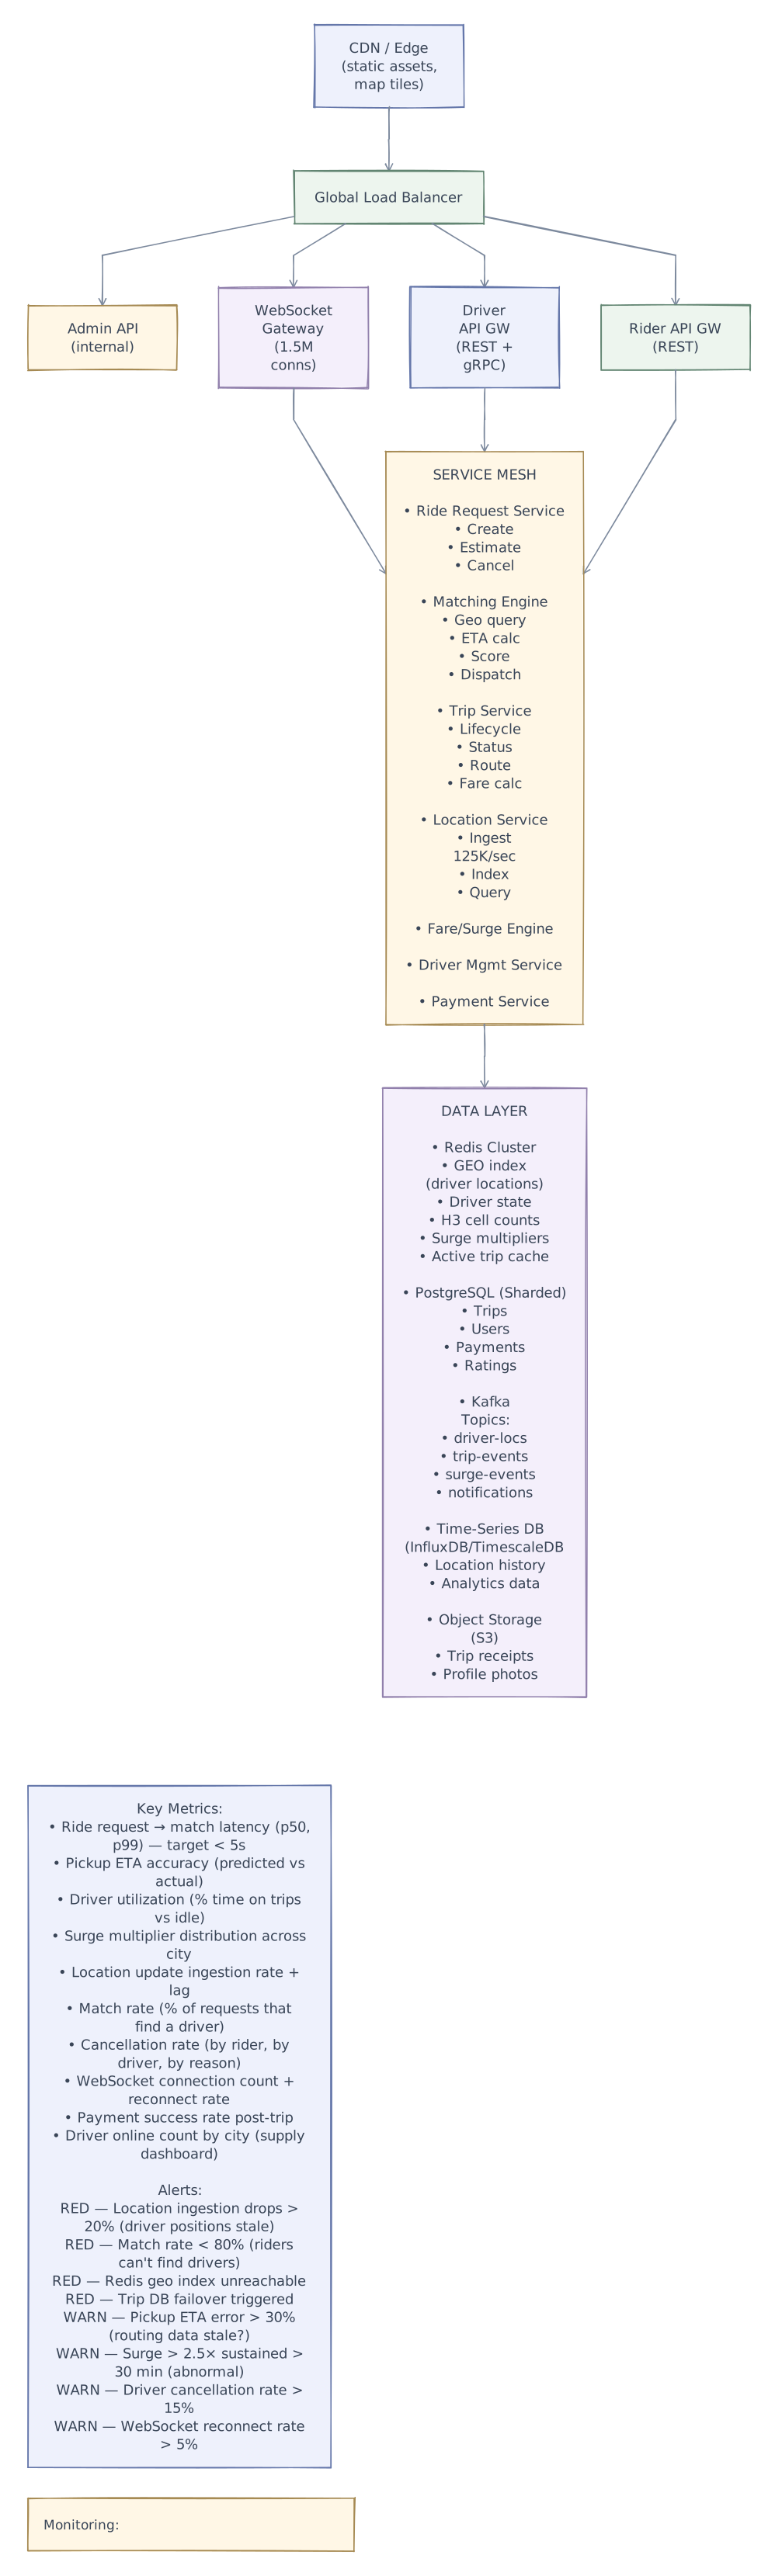
High-Level Architecture

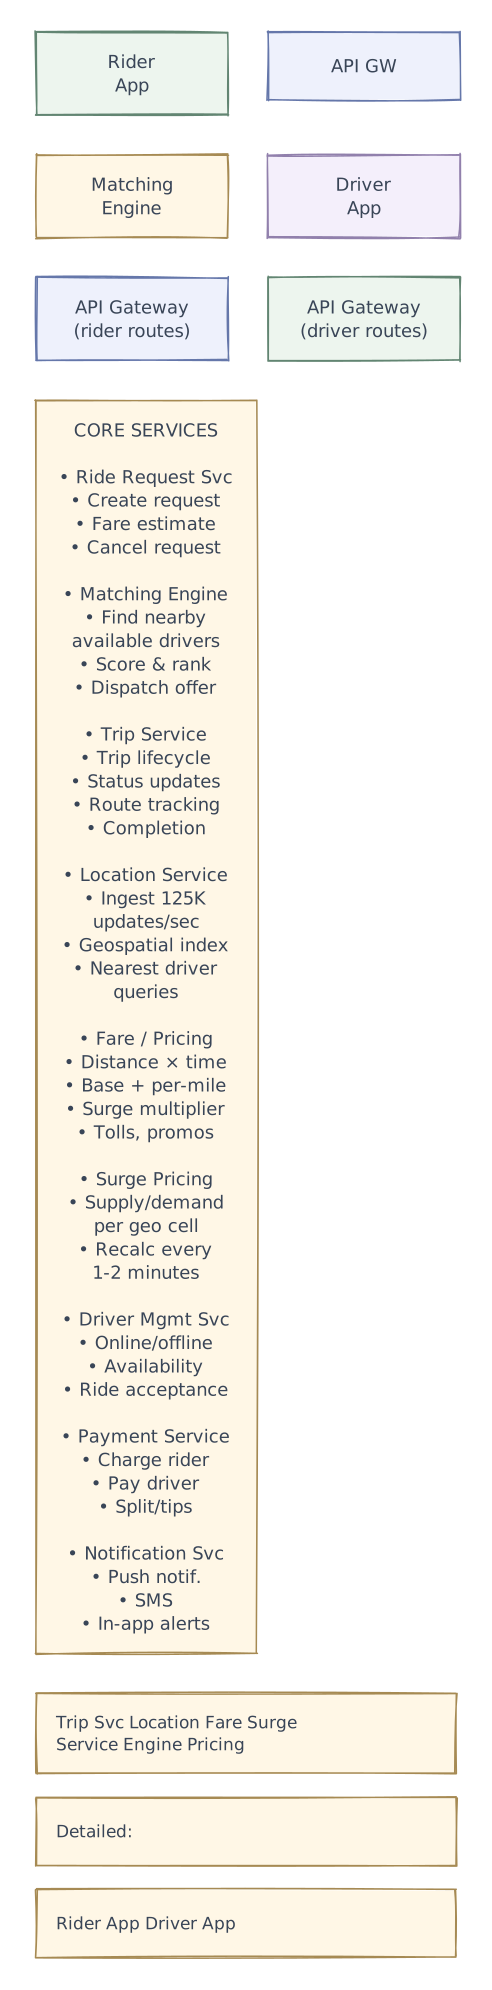
Component Breakdown

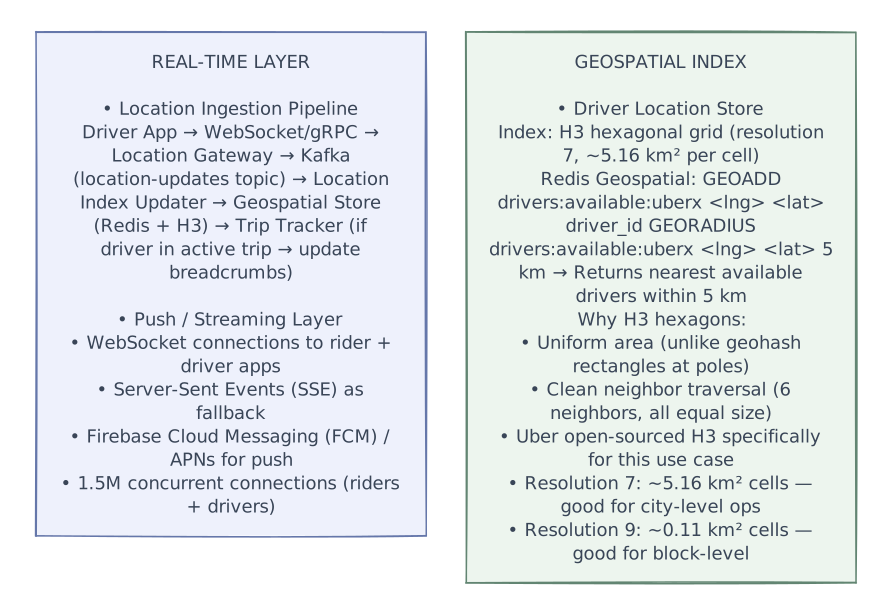
Full System Architecture (Production-Grade)

Further exploration
Offer one ride to several drivers under a timed acceptance policy. Two accept almost together. Identify the single conditional state change that chooses the winner, and specify what the others see. Repeat the exercise with a rider cancellation racing the winning acceptance.
Interview playbook
Interview Tips
Lead with the location ingestion challenge — "500K drivers sending GPS every 3-4 seconds = 125K writes/sec. You can't poll a SQL database for this." Explain: WebSocket → Kafka → multiple consumers (geo index, trip tracking, analytics). This shows you understand the scale of the real-time data pipeline.
H3 hexagonal grid is the key insight — Don't just say "geohash." Explain why Uber open-sourced H3: uniform cell area (unlike geohash rectangles distorted at poles), clean neighbor traversal (6 neighbors, all equal), and dual use for both proximity queries and surge pricing aggregation per cell.
Matching is a scoring problem, not just nearest driver — ETA matters more than straight-line distance. A driver 500m away facing away is worse than one 800m away heading toward you. Scoring: pickup_ETA × 0.5 + driver_rating × 0.15 + acceptance_rate × 0.1 + idle_time × 0.15 + heading × 0.1.
Double-dispatch prevention = Redis SET NX EX — Same atomic lock pattern as ticket booking. Driver state transitions (available → offered → on_trip) must be atomic. SET NX EX gives you: atomicity, TTL-based timeout, no distributed lock complexity.
Batch matching for high demand — Most candidates describe greedy one-at-a-time matching. Explain: during peak, collect requests in 2-second windows, solve bipartite assignment to minimize total pickup ETAs. Hungarian algorithm or greedy with re-optimization. Shows algorithmic depth.
Surge pricing is a supply/demand feedback loop — Compute ratio per H3 cell every 1-2 minutes. Demand = ride requests, supply = available drivers. Surge incentivizes drivers to move to high-demand areas, and reduces rider demand (some wait). Equilibrium is the goal, not maximum revenue.
ETA is harder than it looks — Routing engine gives baseline, but ML model captures: time-of-day patterns, weather, events, historical accuracy. Pre-compute ETA matrix between popular H3 cells to reduce real-time routing calls by 70%.
Shared rides (Pool) show algorithmic depth — Detour ratio constraint: matched riders must add < 40% extra distance. Ordering optimization (who gets picked up/dropped off first). Real-time re-matching (add co-rider after trip starts).
Graceful degradation is critical — If Redis geo index is down, fall back to PostGIS (slower but works). If Kafka is down, bypass to Redis directly. If surge engine is down, default to 1.0×. Every component has a degraded mode.
End with the scale numbers — "125K location updates/sec ingested via Kafka. Matching in < 5 seconds using Redis GEO + H3 across 500K drivers. 1M concurrent trips tracked via WebSocket push every 3-4 seconds. Surge recalculated every 1-2 minutes across 100K+ H3 cells."