Requirements & scope
Problem Statement & Requirements
Design a large-scale metrics collection, storage, alerting, and visualization platform that ingests millions of time-series data points per second from infrastructure and applications, stores them efficiently, and powers real-time dashboards and alerts — similar to Datadog, Prometheus + Grafana, New Relic, or Splunk.
Functional Requirements
- Metrics ingestion — collect counters, gauges, histograms, and summaries from agents, SDKs, and push APIs
- Time-series storage — store metric data points (timestamp, value, tags) with configurable retention
- Querying — flexible query language for aggregation (sum, avg, p99, rate), grouping (by host, service, region), and time-range selection
- Dashboards — build and share real-time dashboards with charts, tables, heatmaps, and topN lists
- Alerting — define threshold, anomaly, and composite alerts; route notifications (PagerDuty, Slack, email)
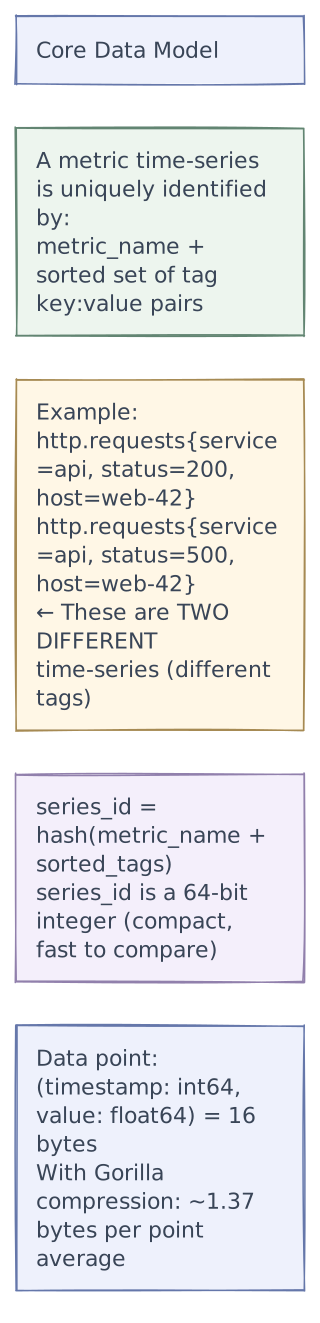
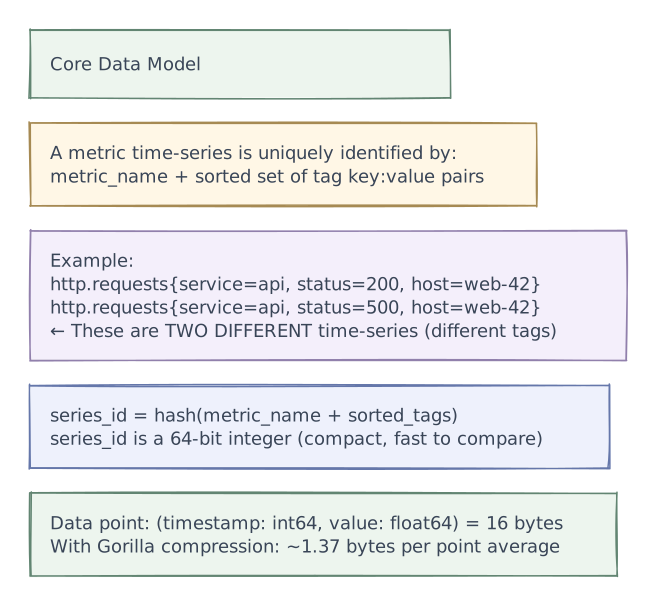
- Tagging / Dimensions — every metric has tags (key:value) for flexible slicing (e.g.,
http.requests{service=api,status=200,region=us-east}) - Downsampling / Rollups — automatically aggregate older data to coarser granularity (1s → 1m → 1h) to save storage
- Anomaly detection — ML-based detection of unexpected patterns (spike, drop, trend shift)
- Service-level objectives (SLOs) — define and track SLIs/SLOs with error-budget burn-rate alerts
Non-Functional Requirements
- High write throughput — ingest 10M+ data points per second
- Low query latency — dashboard queries return in < 500 ms even over weeks of data
- High availability — 99.99% for ingestion (if monitoring goes down, you're flying blind)
- Durability — metrics data must not be lost once acknowledged
- Horizontal scalability — scale ingestion and storage independently
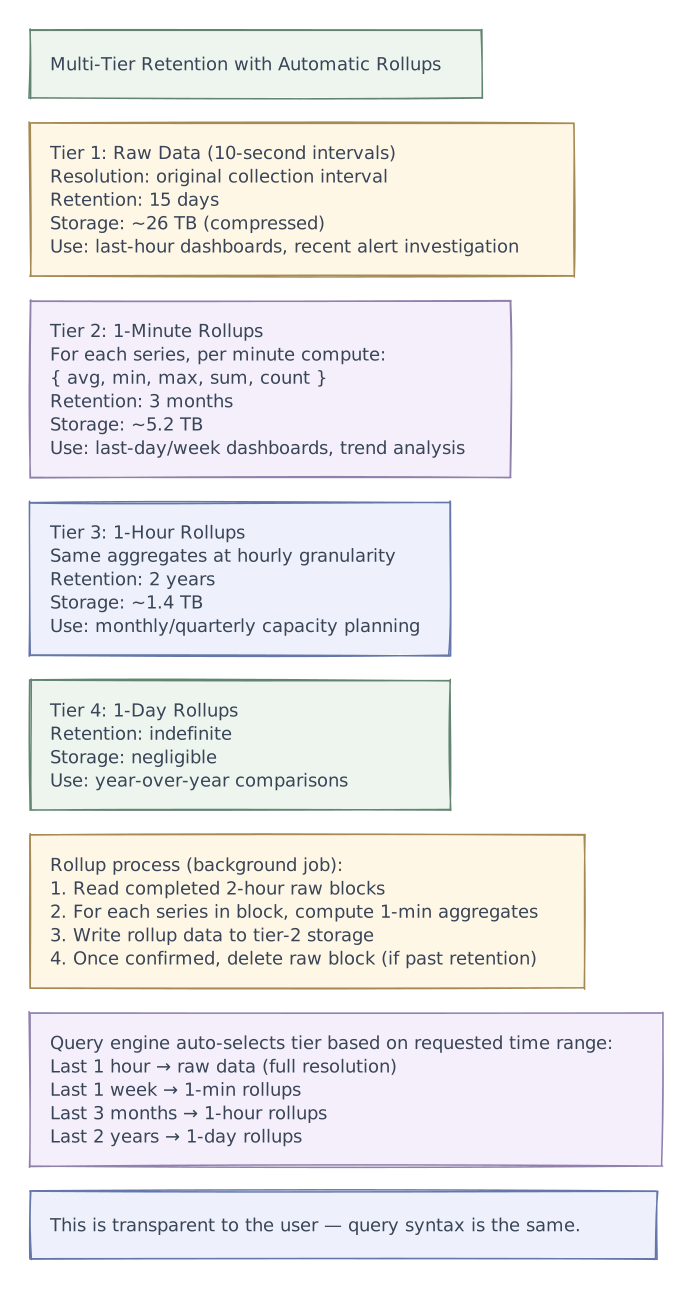
- Retention — configurable: raw data 15 days, 1-min rollups 3 months, 1-hour rollups 2 years
- Multi-tenancy — support thousands of customers with isolation and per-tenant rate limits
Out of Scope
- Log aggregation (ELK/Splunk detailed design)
- Distributed tracing (Jaeger/Zipkin)
- APM (Application Performance Monitoring) code-level profiling
- Synthetic monitoring (external probing)
Scale estimations
Scale Estimations
Traffic
| Metric | Value |
|---|---|
| Active metric time-series (unique tag combinations) | 1B |
| Data points ingested / second | 10M |
| Data points ingested / day | 10M × 86,400 = ~864B |
| Query requests / second (dashboards + alerts) | 50K RPS |
| Active dashboards (refreshing) | 500K |
| Active alert rules | 5M |
| Alert evaluations / second | 5M rules / 60s cadence = ~83K evaluations/sec |
| Customers (multi-tenant) | 50K |
Storage
| Metric | Value |
|---|---|
| Raw data point size | 16 bytes (8B timestamp + 8B float64 value) |
| Tags per data point | avg 100 bytes (stored as tag-set hash → 8 bytes reference) |
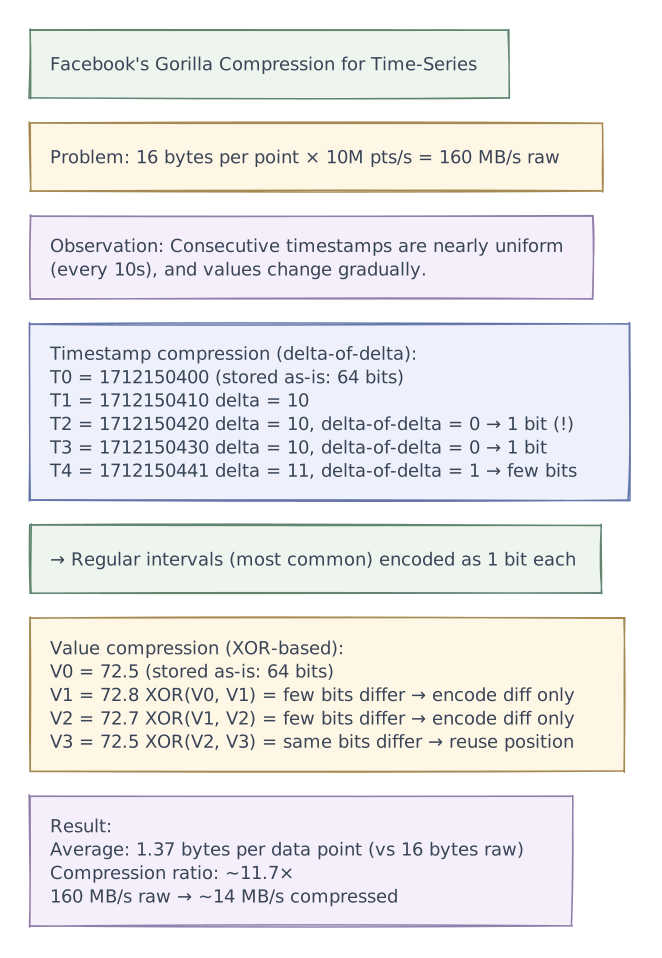
| Effective per-point storage (with compression) | ~2-4 bytes (Gorilla compression: 1.37 bytes/point avg) |
| Raw data (15 days) | 864B/day × 15 × 2 bytes = ~26 TB |
| 1-min rollups (3 months) | 864B / 60 × 90 × 4 bytes = ~5.2 TB |
| 1-hour rollups (2 years) | 864B / 3600 × 730 × 8 bytes = ~1.4 TB |
| Tag metadata index | 1B series × 200 bytes = ~200 GB |
| Total storage | ~33 TB (with compression — remarkably compact) |
Bandwidth
| Metric | Value |
|---|---|
| Ingestion (10M pts/s × 24 bytes avg including tags) | ~240 MB/s |
| Query responses (50K/s × 10 KB avg) | ~500 MB/s |
| Internal replication | ~480 MB/s (2× ingestion) |
Hardware Estimate
| Component | Spec |
|---|---|
| Ingestion gateways | 20-50 (stateless, auto-scaling) |
| Kafka (ingestion buffer) | 10-20 brokers |
| Time-series storage nodes | 50-100 (SSD-backed) |
| Query / aggregation nodes | 30-50 (CPU + RAM heavy) |
| Tag index (inverted index) | 10-20 nodes |
| Alert evaluation workers | 20-50 |
| Redis (alert state, recent data) | 10-20 nodes |
Layered architecture
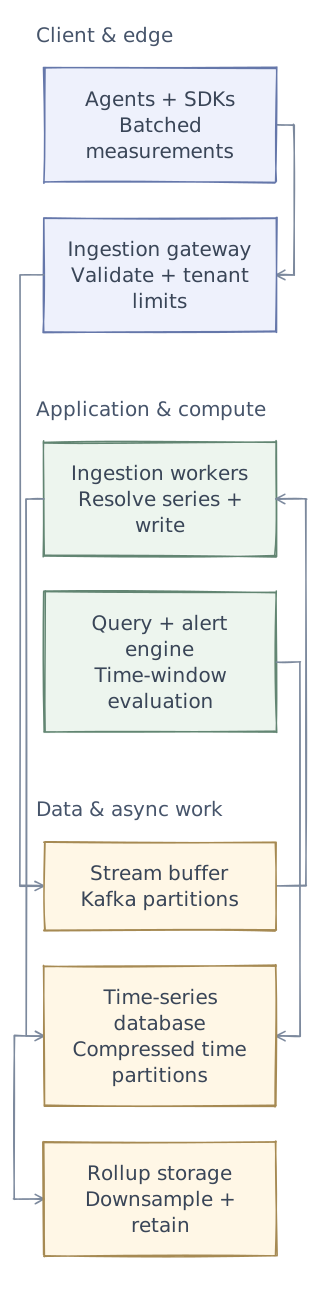
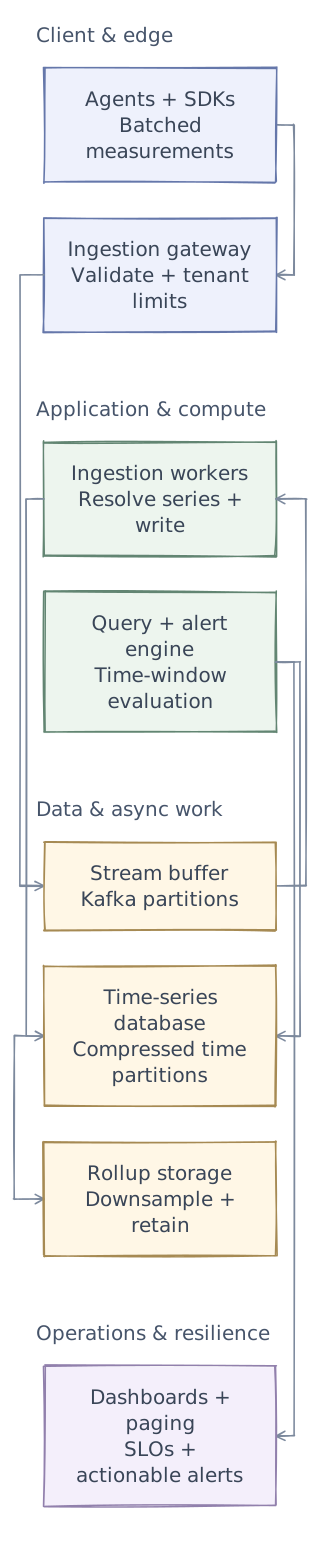
Phase 1 of 4 · Client & edge
Start with the entry points
First, define who uses the system and where requests enter. This is the boundary of the design, not yet a complete request path.
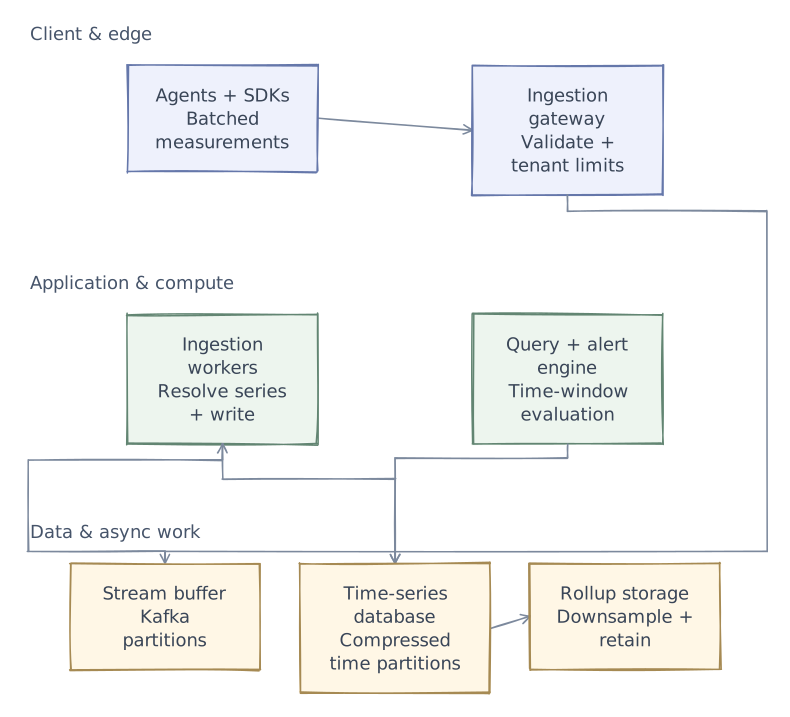
- Agents + SDKs
- Collect timestamped metrics with controlled label cardinality and bounded local buffers.
- Ingestion gateway
- Authenticate writers, normalize samples, and reject cardinality explosions early.
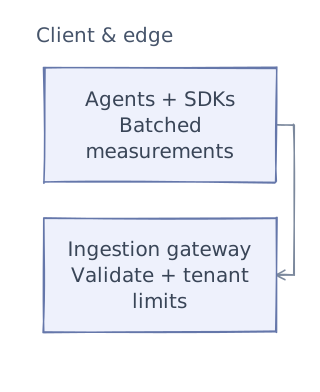
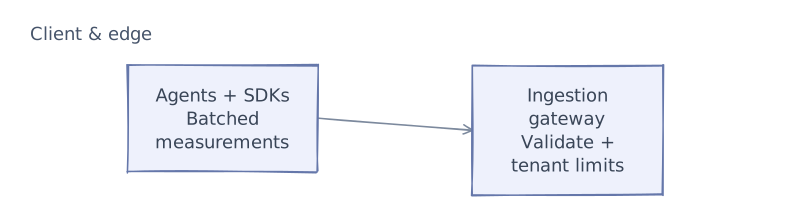
This first layer defines the system boundary. The next chapters add application logic and data dependencies. After examining the request paths and tradeoffs, we will add operational safeguards and bring the complete architecture together.
API & contracts
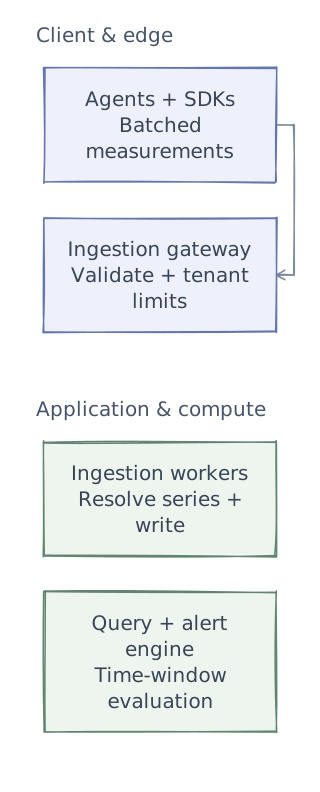
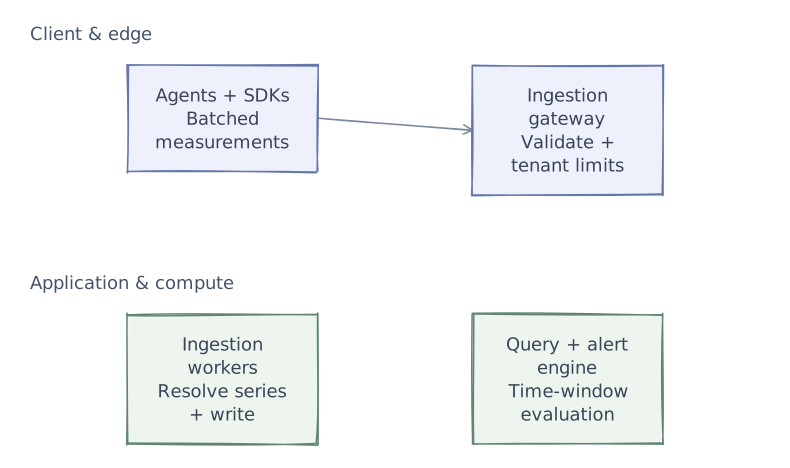
Phase 2 of 4 · Application & compute
Add the application logic
Keep the entry points and add the services that do the work. Give each service a clear responsibility before defining its contracts. Storage and background dependencies come next.
- Ingestion workers
- Turn label sets into series identities and write samples efficiently in batches.
- Query + alert engine
- Query recent windows and evaluate alert rules with explicit handling for missing data.
API Design
Submit Metrics (Push API)
POST /api/v1/series
Content-Type: application/json
DD-API-KEY: <api_key>

Request:
{
  "series": [
    {
      "metric": "http.requests",
      "type": "count",
      "interval": 10,
      "points": [[1712150400, 1523], [1712150410, 1487]],
      "tags": ["service:api", "status:200", "region:us-east"],
      "host": "web-server-42"
    },
    {
      "metric": "system.cpu.user",
      "type": "gauge",
      "points": [[1712150400, 72.5]],
      "tags": ["host:web-server-42", "env:production"],
      "host": "web-server-42"
    }
  ]
}

Response (202 Accepted):
{
  "status": "ok",
  "points_accepted": 3
}
Query Metrics
POST /api/v1/query
Authorization: Bearer <token>

Request:
{
  "query": "avg:http.latency{service=api,region=us-east} by {status_code}",
  "from": 1712146800,    // epoch seconds
  "to": 1712150400,      // last 1 hour
  "rollup": {
    "method": "avg",
    "interval": 60        // 1-minute buckets
  }
}

Response (200 OK):
{
  "series": [
    {
      "metric": "http.latency",
      "tags": {"service": "api", "region": "us-east", "status_code": "200"},
      "pointlist": [
        [1712146800, 23.4],
        [1712146860, 25.1],
        [1712146920, 22.8],
        ...
      ],
      "unit": "milliseconds",
      "query_index": 0
    },
    {
      "metric": "http.latency",
      "tags": {"service": "api", "region": "us-east", "status_code": "500"},
      "pointlist": [[1712146800, 187.3], ...],
      "unit": "milliseconds",
      "query_index": 0
    }
  ],
  "query_time_ms": 87
}
Create Alert
POST /api/v1/monitors
Authorization: Bearer <token>

Request:
{
  "name": "High API Error Rate",
  "type": "metric_alert",
  "query": "avg(last_5m):sum:http.errors{service=api} / sum:http.requests{service=api} > 0.05",
  "message": "@pagerduty-oncall API error rate is above 5%! Check {{host}}.",
  "tags": ["team:platform", "severity:critical"],
  "options": {
    "thresholds": {
      "critical": 0.05,
      "warning": 0.02
    },
    "notify_no_data": true,
    "no_data_timeframe": 10,
    "evaluation_delay": 60,
    "renotify_interval": 300
  }
}

Response (201 Created):
{
  "monitor_id": 12345,
  "name": "High API Error Rate",
  "status": "OK",
  "created_at": "2026-04-03T10:00:00Z"
}
Create Dashboard
POST /api/v1/dashboards
Authorization: Bearer <token>

Request:
{
  "title": "API Health Dashboard",
  "widgets": [
    {
      "type": "timeseries",
      "title": "Request Rate",
      "queries": [
        {"query": "sum:http.requests{service=api} by {status_code}.as_rate()", "display_type": "bars"}
      ],
      "time": {"live_span": "1h"}
    },
    {
      "type": "query_value",
      "title": "p99 Latency",
      "queries": [
        {"query": "p99:http.latency{service=api}", "aggregator": "last"}
      ],
      "conditional_formats": [
        {"comparator": ">", "value": 500, "palette": "red"},
        {"comparator": ">", "value": 200, "palette": "yellow"}
      ]
    },
    {
      "type": "toplist",
      "title": "Top Error Endpoints",
      "queries": [
        {"query": "sum:http.errors{service=api} by {endpoint}.as_count()"}
      ],
      "limit": 10
    }
  ]
}Data model
Phase 3 of 4 · Data & async work
Connect data and background work
The services now need their dependencies: durable state, fast lookups, or work that continues outside a request. Separate these responsibilities rather than treating every component as a database.
- Stream buffer
- Absorb ingestion spikes and replay after storage incidents without blocking collection indefinitely.
- Time-series database
- Optimize for sequential samples, retention windows, and range queries.
- Rollup storage
- Keep high-resolution recent data and coarser history with declared aggregation semantics.
Data Model
Time-Series Data Point
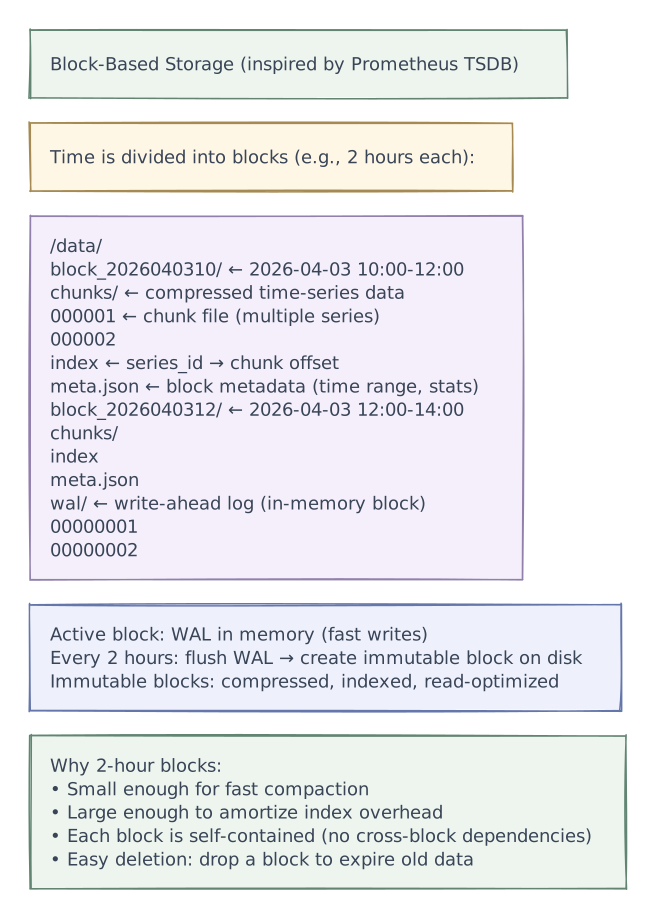
On-Disk Storage Layout (Time-Partitioned Blocks)

Gorilla Compression (Core Innovation)

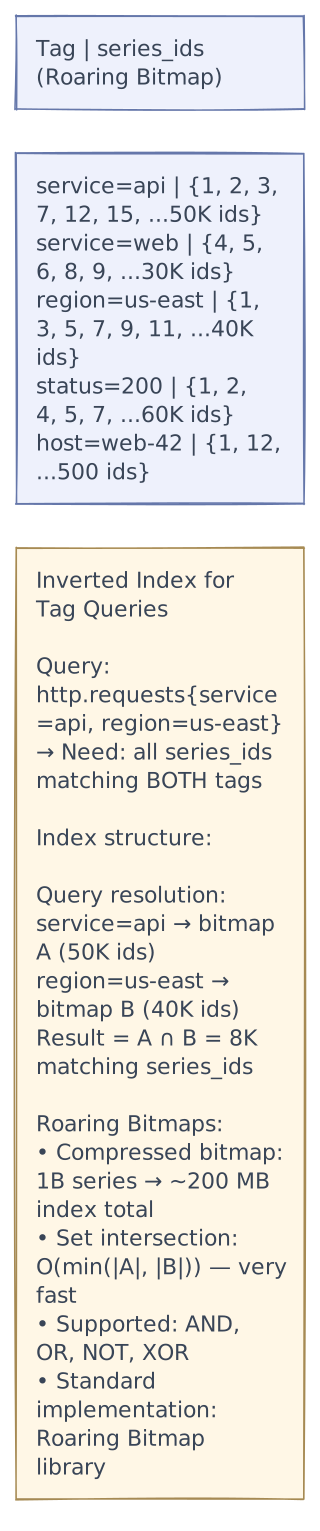
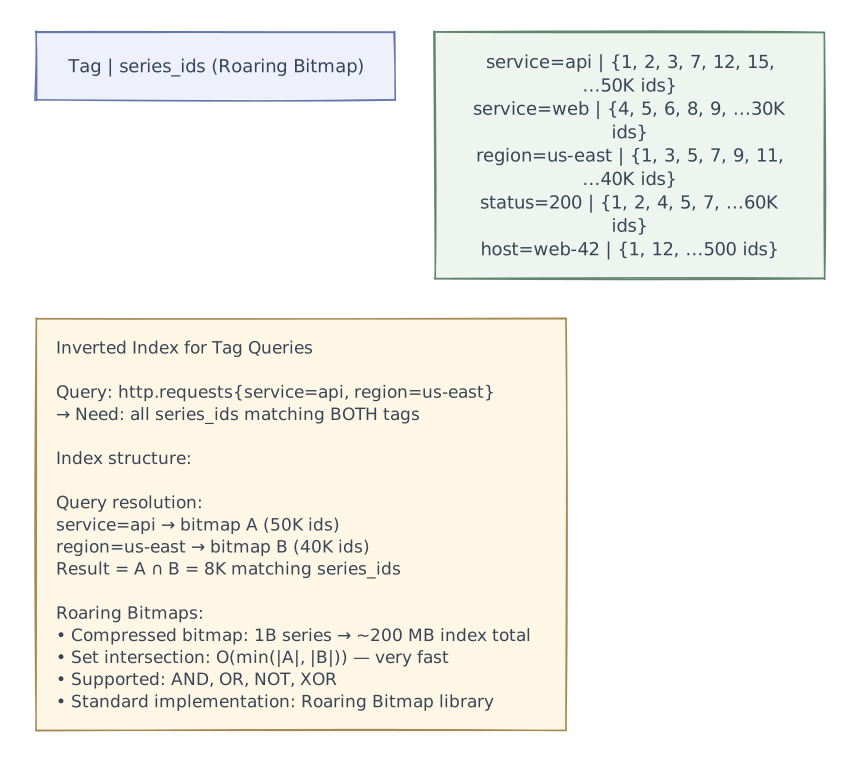
Tag Inverted Index
Core design decisions
Core Design Decisions
Decision 1: Push vs Pull Collection Model

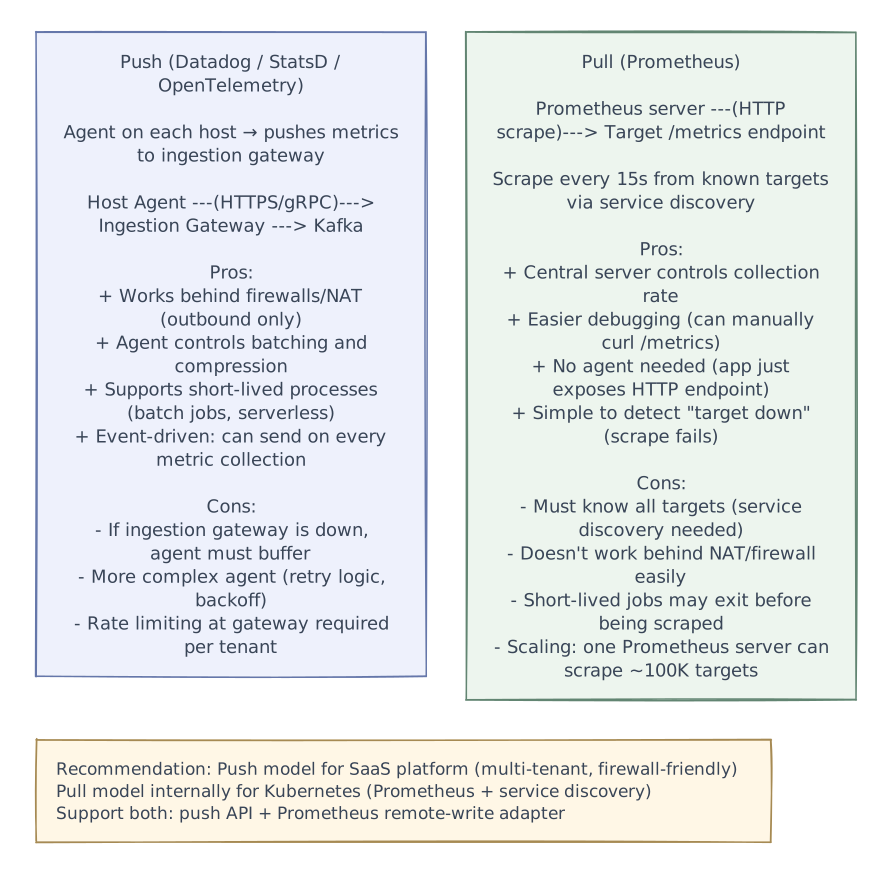
Decision 2: Time-Series Storage Engine

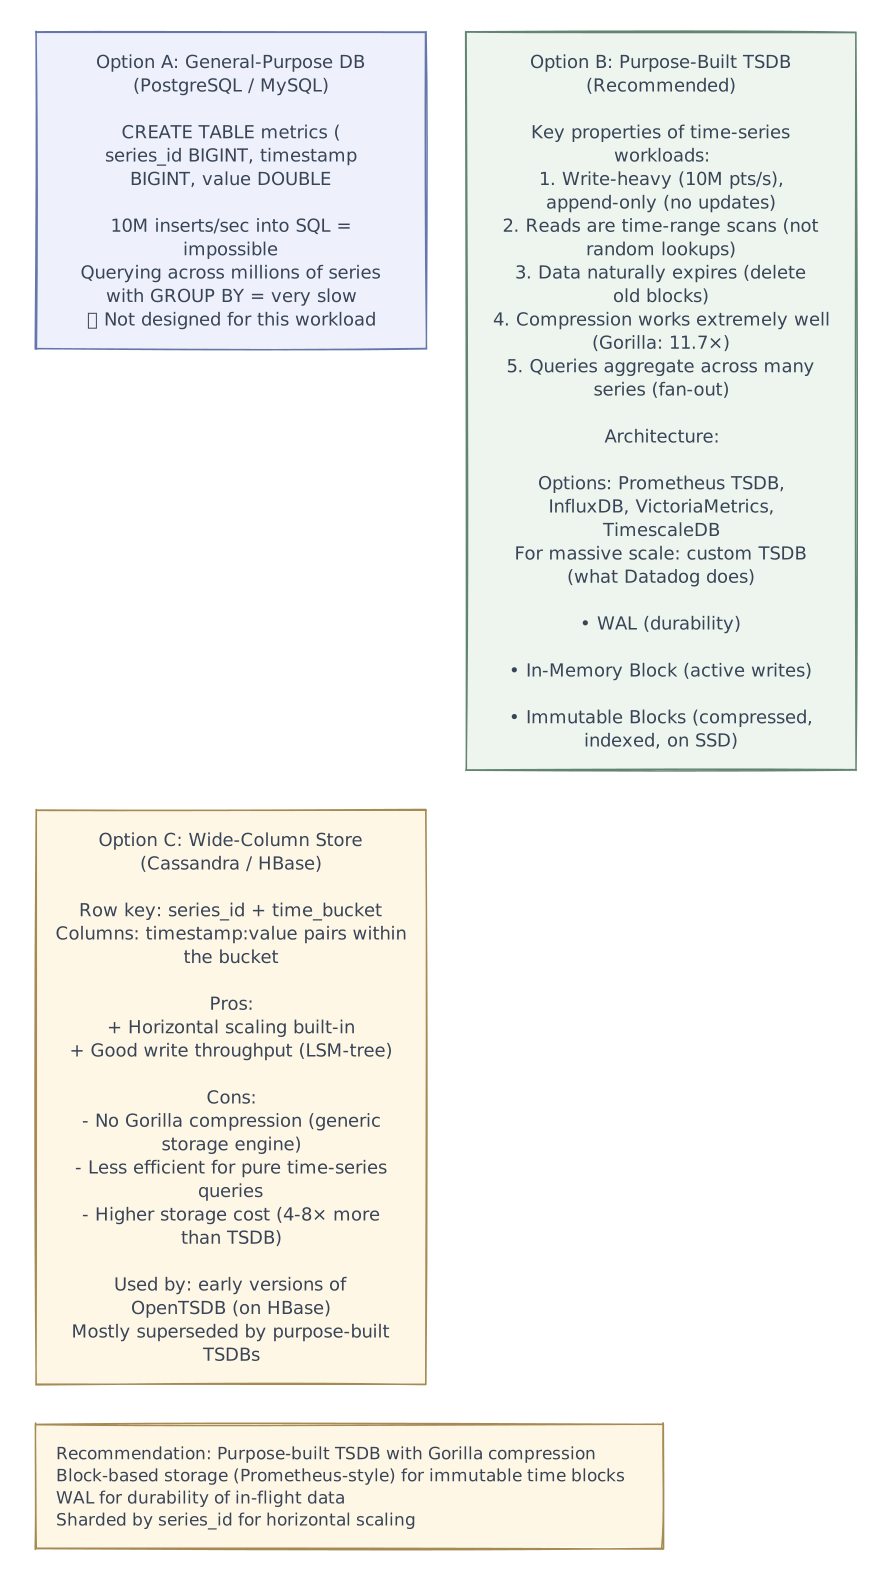
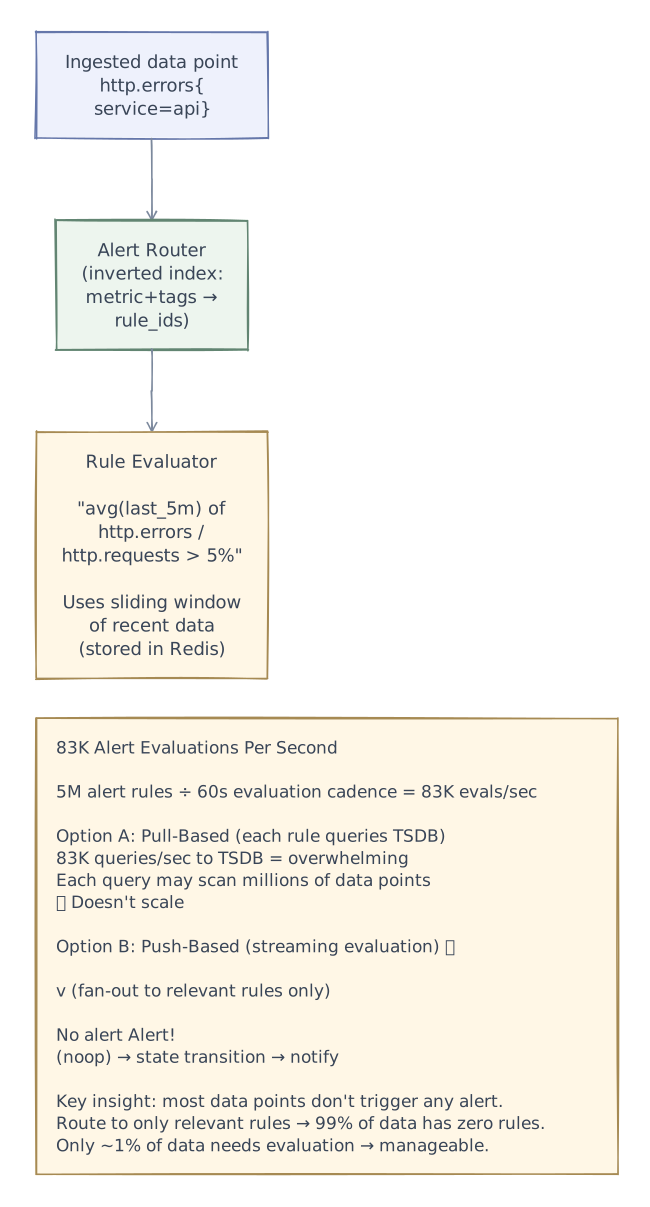
Decision 3: Alert Evaluation Architecture

Request flows
Detailed Flow Diagrams
Metrics Ingestion Flow

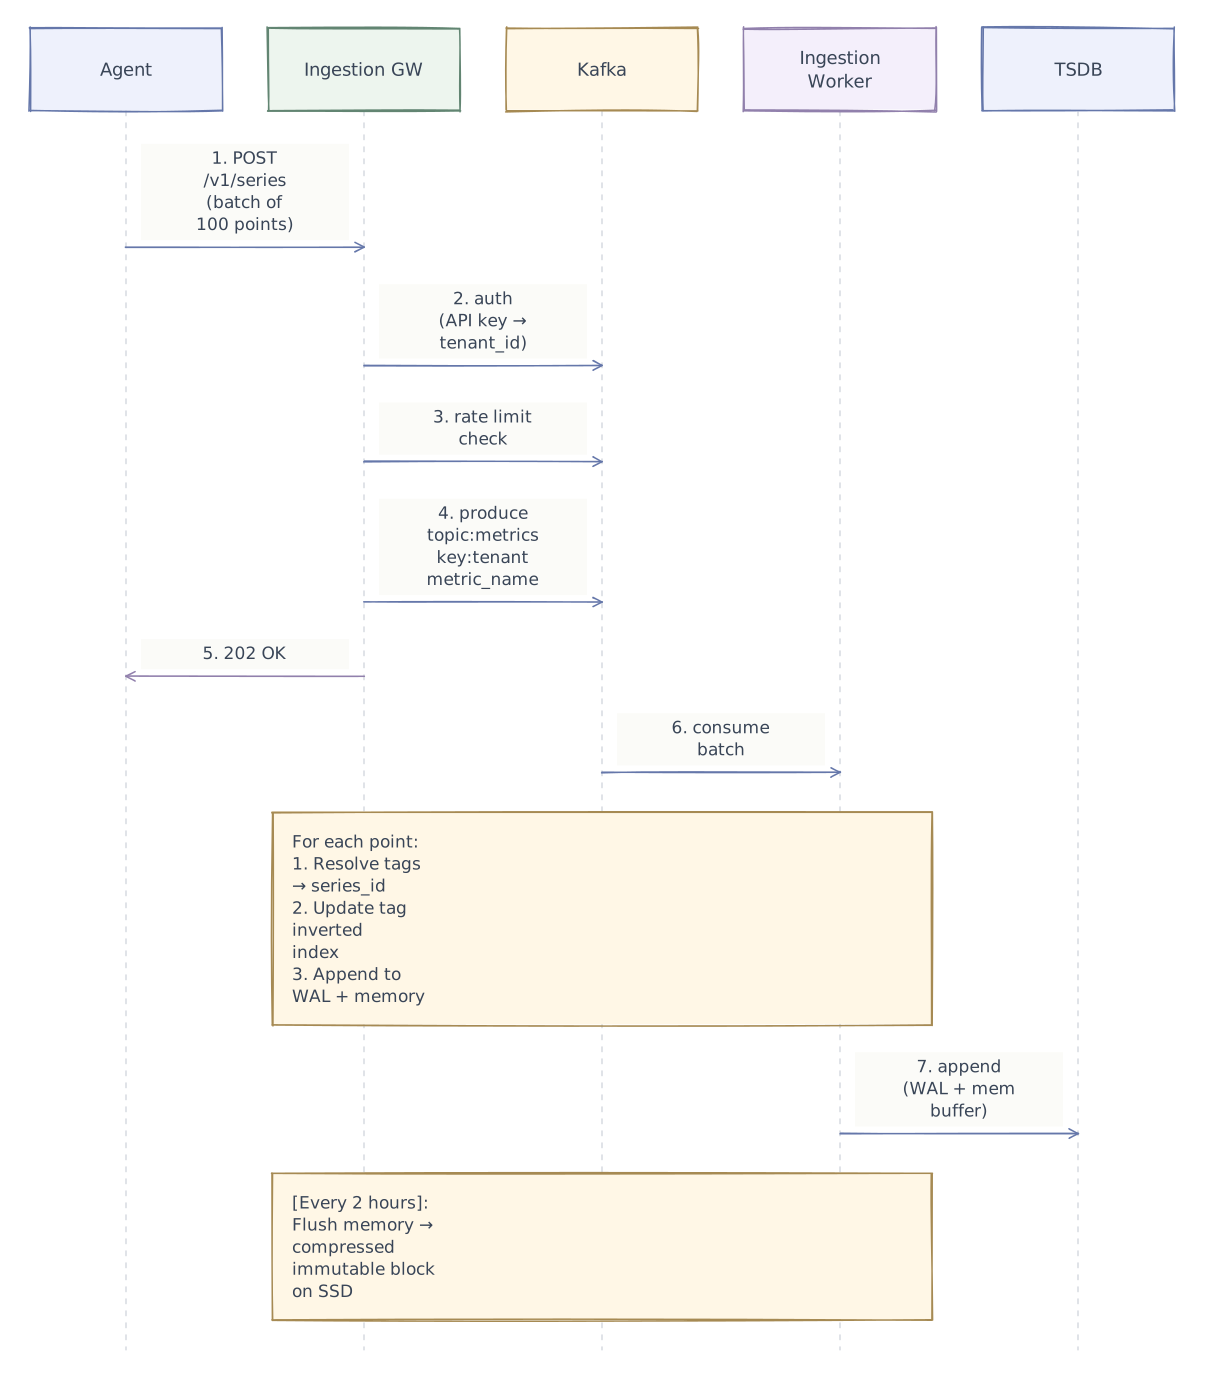
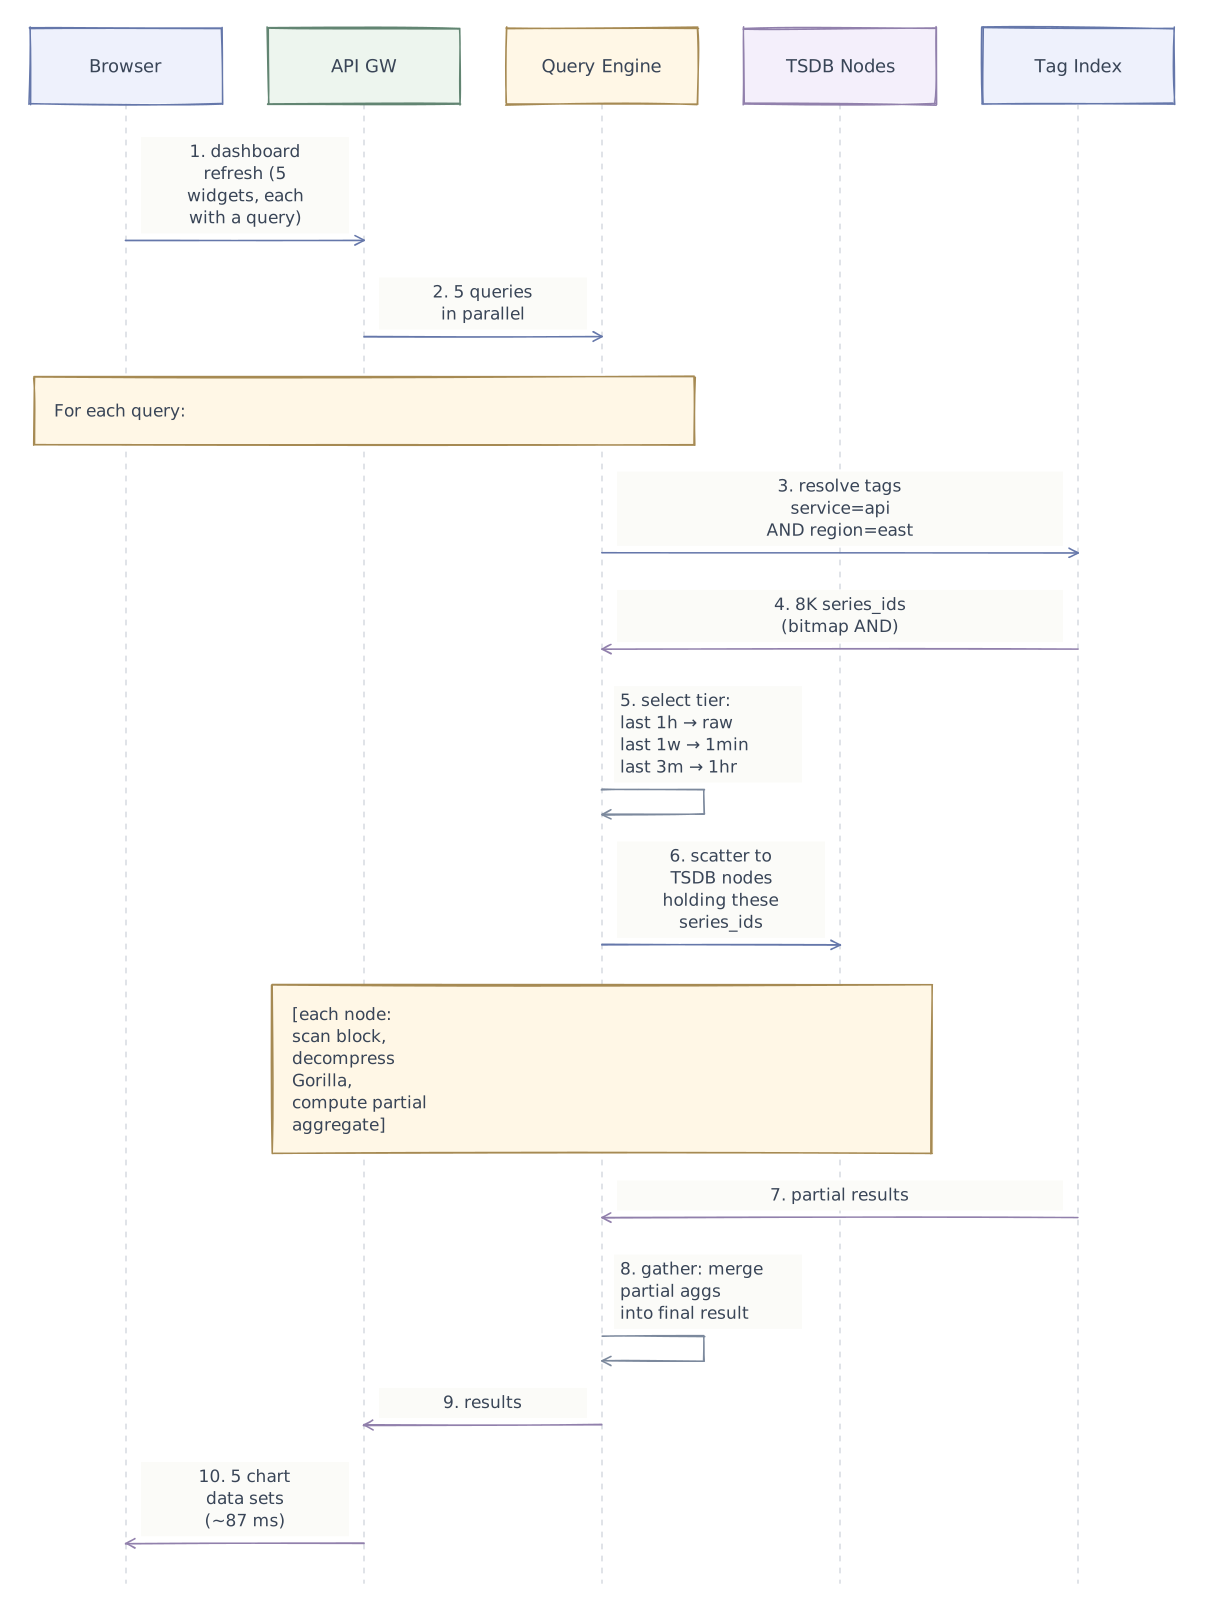
Dashboard Query Flow

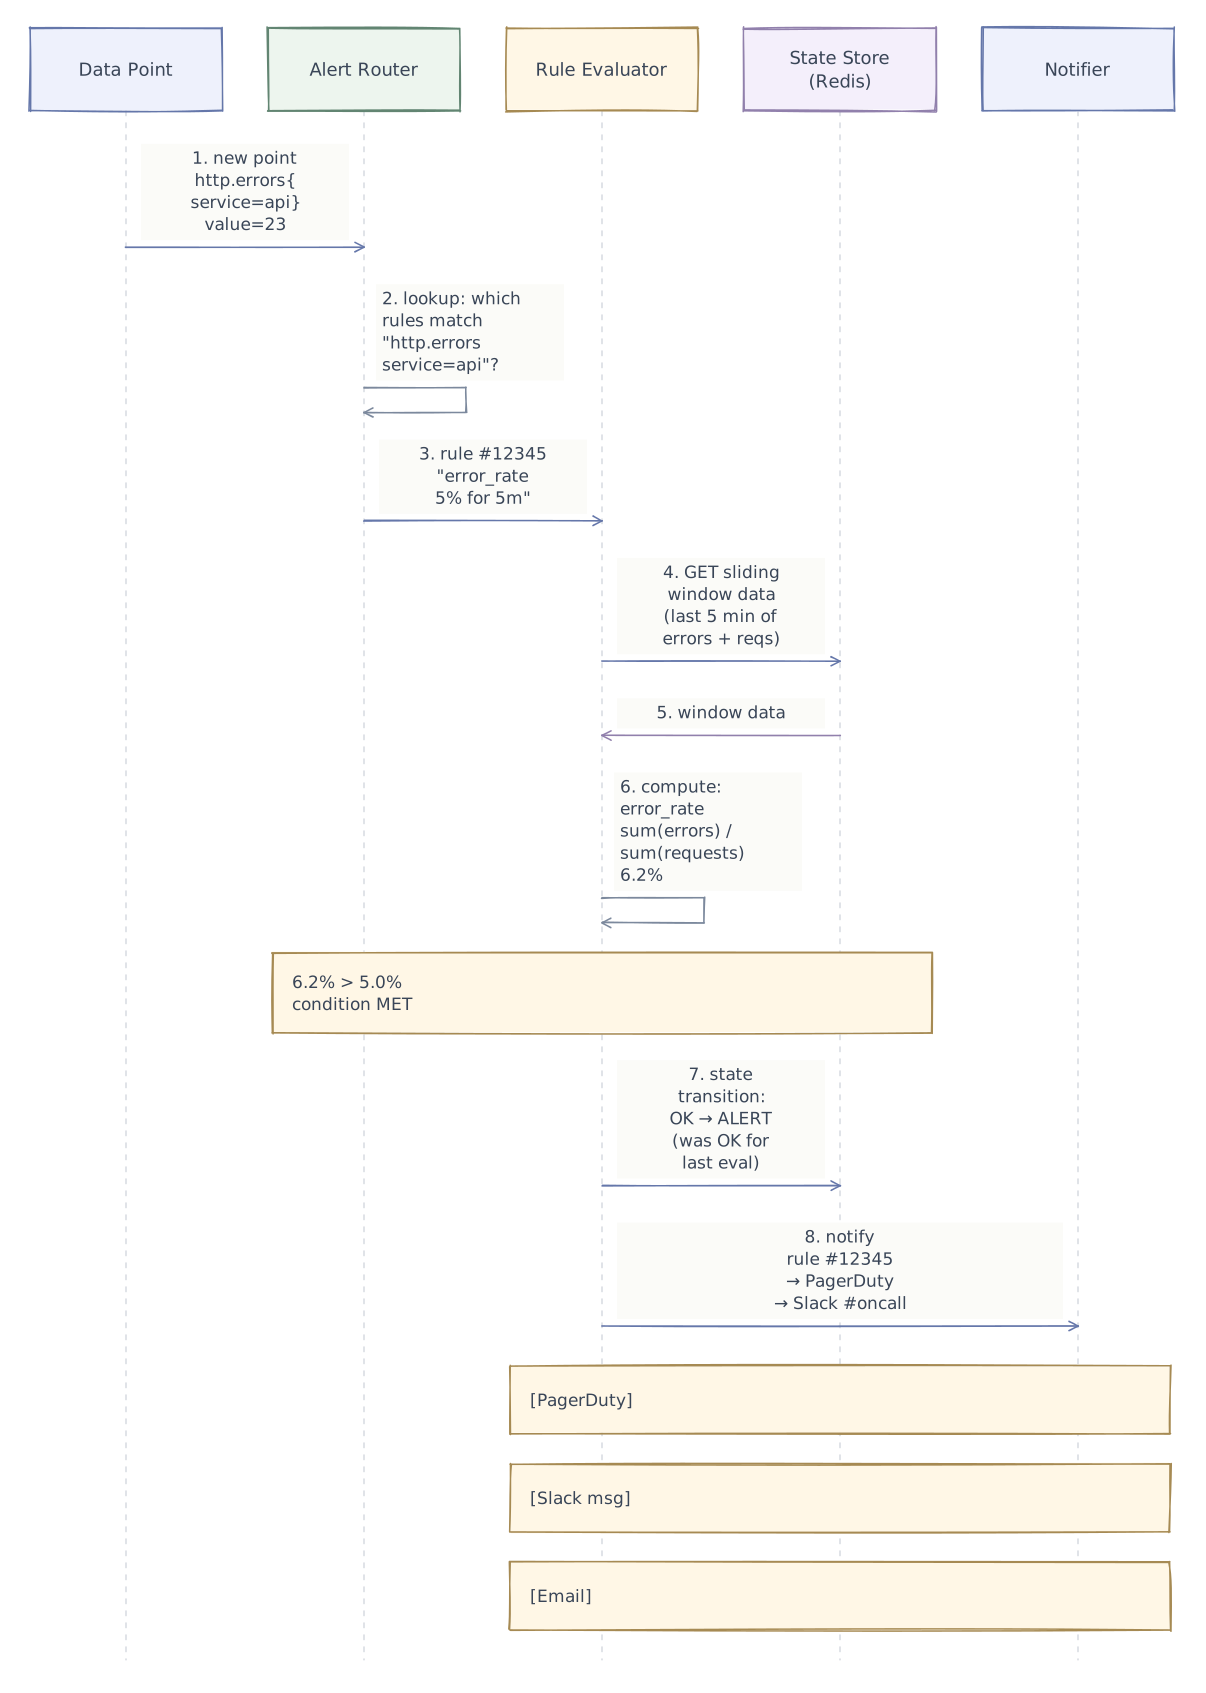
Alert Evaluation + Notification Flow

Performance & caching
Downsampling & Retention

Advanced design
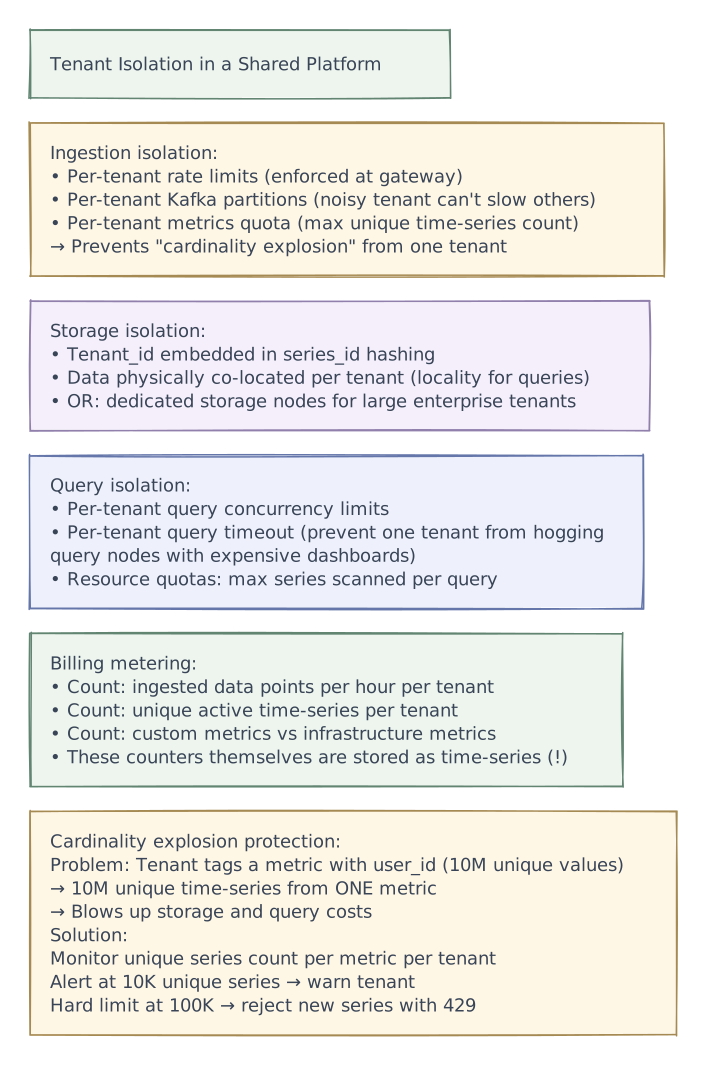
Multi-Tenancy

Edge cases
Handling Edge Cases
High-Cardinality Tags
Problem: Metric http.requests tagged with request_id (unique per request)
  → Billions of unique series → unbounded storage growth
  → Queries become impossibly slow (scan billions of series)

Detection:
  Monitor: unique_series_count per (tenant, metric_name)
  If growth rate > 10K new series/hour → alert

Prevention:
  1. Client-side: agent rejects tags with cardinality > threshold
  2. Server-side: ingestion worker checks new series rate
     → If > 100K unique series for one metric → drop new series
     → Return warning header to agent
  3. Documentation: educate users about low-cardinality tags only
     ✅ service, host, region, status_code, endpoint
     ❌ request_id, user_id, session_id, trace_id
Late-Arriving Data Points
Problem: Agent buffers during network outage → sends 30 min of old data at once

Impact:
  • Data points arrive for already-flushed blocks
  • Alert evaluations may need recalculation

Solution:
  • Accept late data up to a configurable window (e.g., 1 hour)
  • Write to a "late-arrival" WAL segment
  • Merge into existing blocks during next compaction
  • For alerts: re-evaluate sliding windows when late data arrives
  • Reject data older than 1 hour (return 400 with "too old" error)
Clock Skew Across Agents
Problem: Different hosts have slightly different clocks
  → Data points at "same time" have different timestamps
  → Aggregation across hosts produces incorrect results

Solution:
  1. NTP synchronization on all hosts (< 100ms drift acceptable)
  2. Ingestion gateway records server-side receive timestamp
  3. If |agent_timestamp - server_timestamp| > 5 minutes:
     → Override with server timestamp
     → Log warning to agent
  4. Queries tolerate minor drift via configurable alignment window
Alert Flapping
Problem: Metric oscillates around threshold → alert fires/recovers every minute
  → Oncall engineer gets 30 notifications in 30 minutes

Solution: Hysteresis + evaluation window

  Alert: http.error_rate > 5% for 5 minutes
  Recovery: http.error_rate < 3% for 5 minutes   ← different threshold!

  The gap (3% to 5%) is the hysteresis band.
  Must go BELOW 3% to recover, not just below 5%.

  Additional measures:
  • Renotify interval: minimum 5 minutes between notifications
  • Auto-mute if alert fires > 10 times in 1 hour → likely flapping
• Dashboard flag: "This alert is flapping — consider adjusting threshold"Tradeoffs
Tradeoffs & Design Decisions Summary
| Decision | Option A | Option B | Chosen | Why |
|---|---|---|---|---|
| Collection | Pull (Prometheus) | Push (agent-based) | Both (push primary, pull adapter) | Push for multi-tenant SaaS (firewall-friendly); pull adapter for Prometheus compat |
| Storage engine | General-purpose DB | Purpose-built TSDB | TSDB with Gorilla compression | 11.7× compression; append-only optimized; time-partitioned blocks for retention |
| Compression | LZ4/Snappy | Gorilla (delta-of-delta + XOR) | Gorilla | Purpose-built for time-series: 1.37 bytes/point vs 16 bytes raw |
| Tag index | B-tree index | Roaring Bitmaps | Roaring Bitmaps | Compact, fast set intersection for multi-tag queries; handles 1B series |
| Ingestion buffer | Direct to TSDB | Kafka → TSDB | Kafka buffer | Decouples collection from storage; absorbs bursts; enables replay on failure |
| Alert evaluation | Pull (query TSDB per rule) | Push (streaming, route to relevant rules) | Push/streaming | 83K evals/sec via pull = TSDB overload; streaming routes only to affected rules |
| Rollup storage | Same store, flagged | Separate storage tiers | Separate tiers | Different access patterns: raw is write-heavy, rollups are read-heavy |
| Time partitioning | Fixed-size blocks | Time-range blocks (2h) | Time-range (2h) | Self-contained blocks; easy deletion for retention; efficient compaction |
| Query execution | Single-node | Scatter-gather across TSDB nodes | Scatter-gather | Parallel fanout across nodes holding relevant series; gather for final aggregation |
| Multi-tenancy | Separate DB per tenant | Shared cluster with isolation | Shared + isolation | Cost-effective at 50K tenants; per-tenant rate limits + quotas prevent noisy neighbor |
Reliability & fault tolerance
Phase 4 of 4 · Operations & resilience
Add operational safeguards
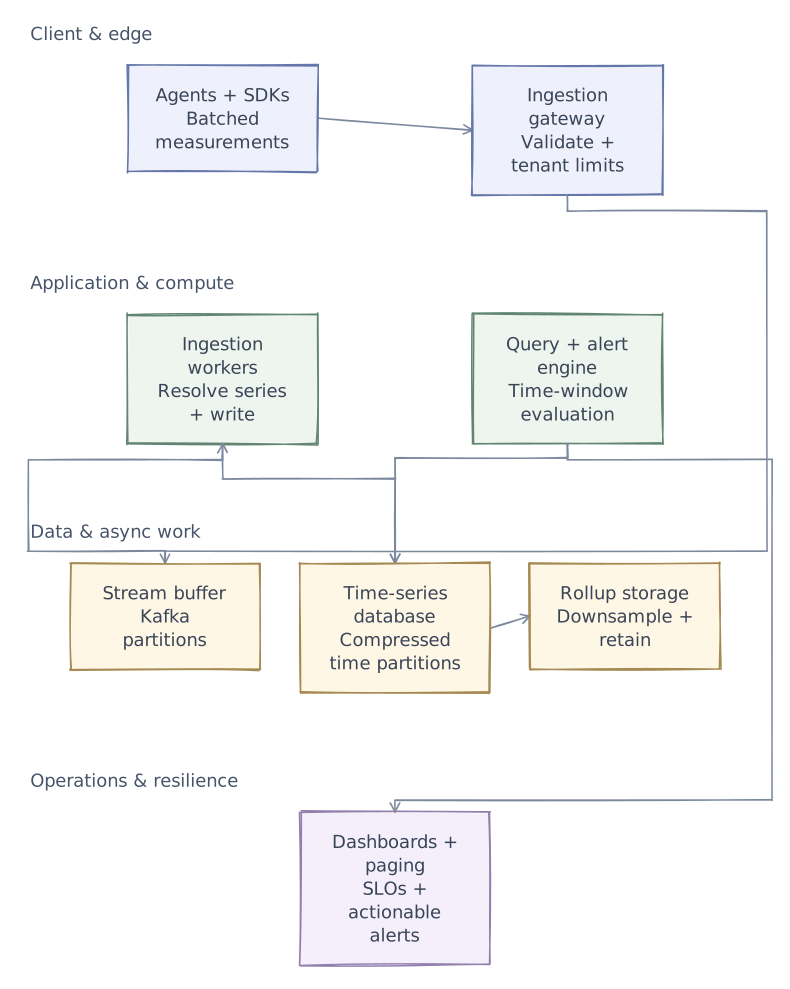
With the request paths and tradeoffs established, add the controls that help detect trouble and keep the system operating. The final diagram retains every layer introduced so far.
- Dashboards + paging
- Separate symptom-based paging from diagnostic dashboards and monitor the monitoring system itself.
Reliability & Fault Tolerance
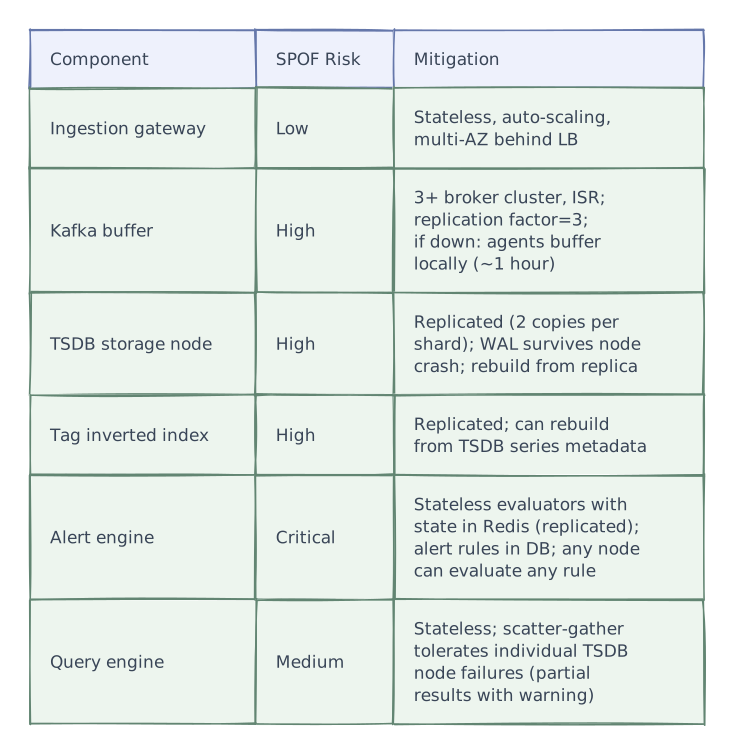
Single Points of Failure & Mitigations

Graceful Degradation
Tier 1 (single TSDB node down):
  → Queries return partial results (other nodes still respond)
  → Warning banner: "Some data may be incomplete"
  → Writes to that shard go to replica

Tier 2 (Kafka down):
  → Agents buffer locally (1 hour of data in memory/disk)
  → Alert evaluations continue on existing recent data
  → When Kafka recovers: agents flush buffered data (late arrival)

Tier 3 (Tag index down):
  → Cannot resolve tag queries (which series match "service=api"?)
  → Fallback: if query specifies exact series_id → still works
  → Dashboard shows "Tag resolution degraded"
  → Rebuild index from TSDB metadata (~minutes)

Tier 4 (Alert engine down):
  → NO ALERTS FIRING — this is the worst failure mode
  → Must be highest priority to recover
  → Mitigation: dead-man's switch alert
    → External service expects heartbeat every 5 min
    → If no heartbeat → alert via independent channel
→ "Alert engine is down" — monitors the monitorsProduction architecture
High-Level Architecture

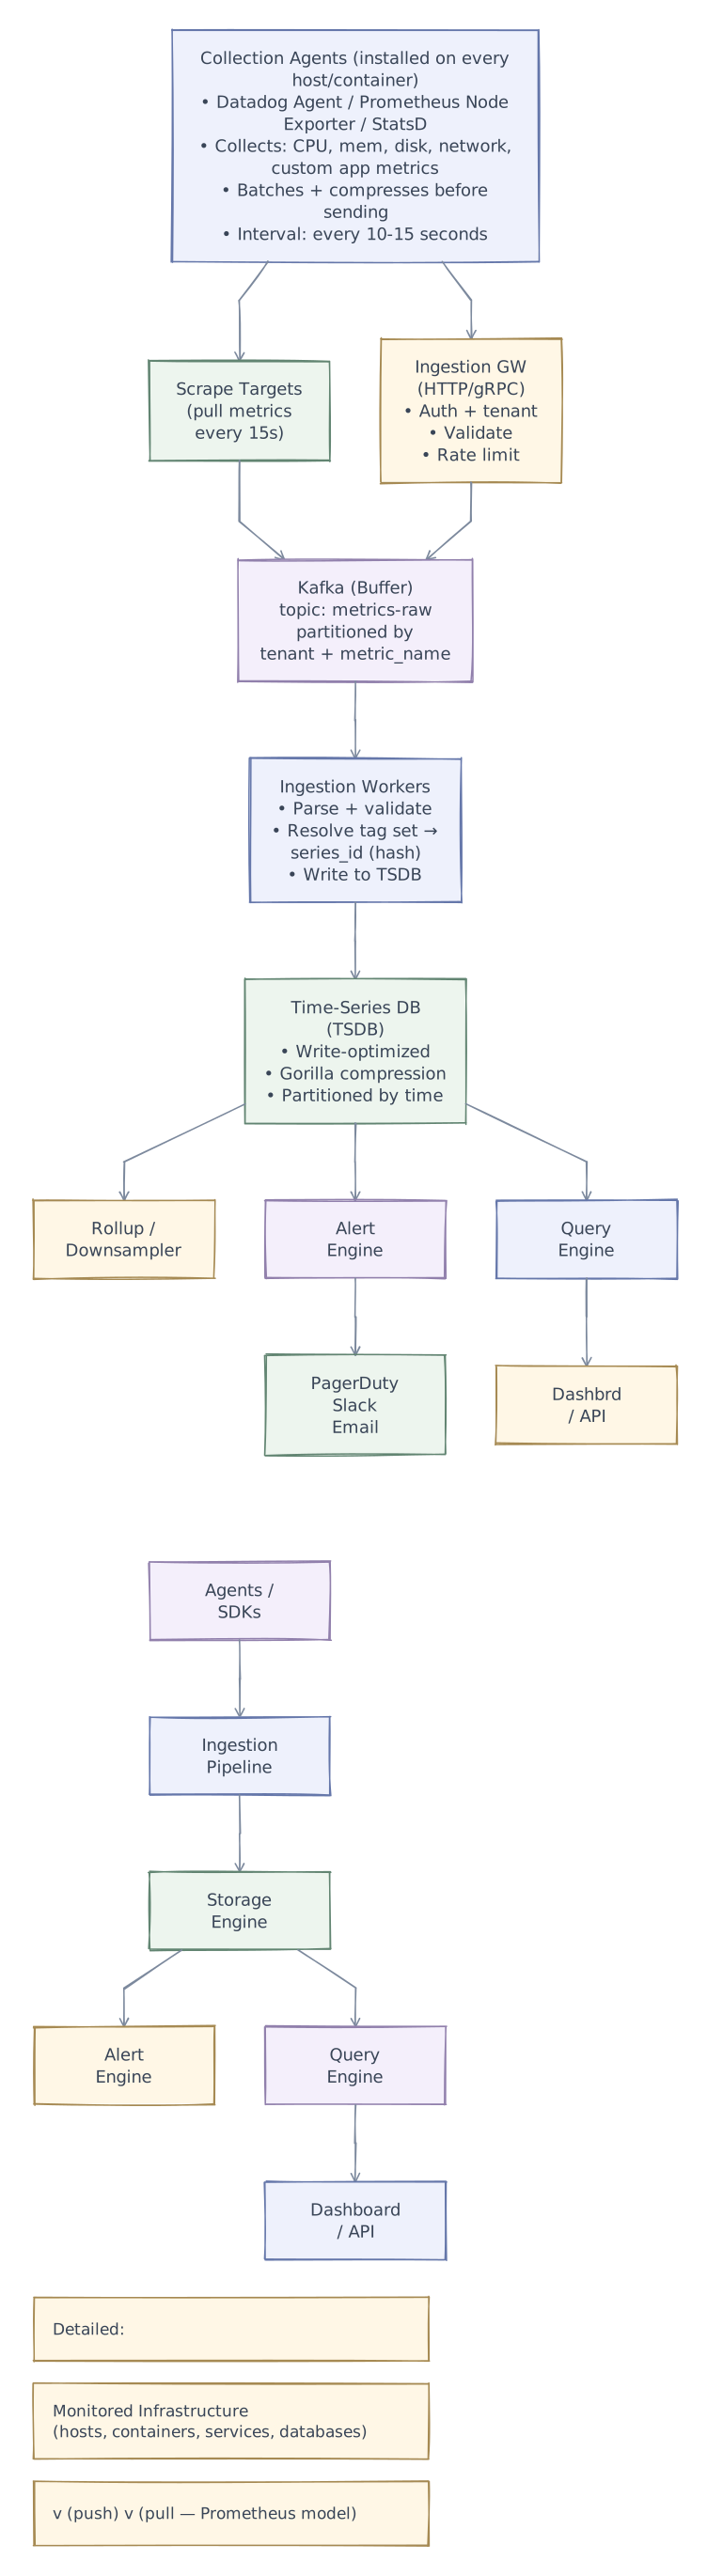
Component Breakdown

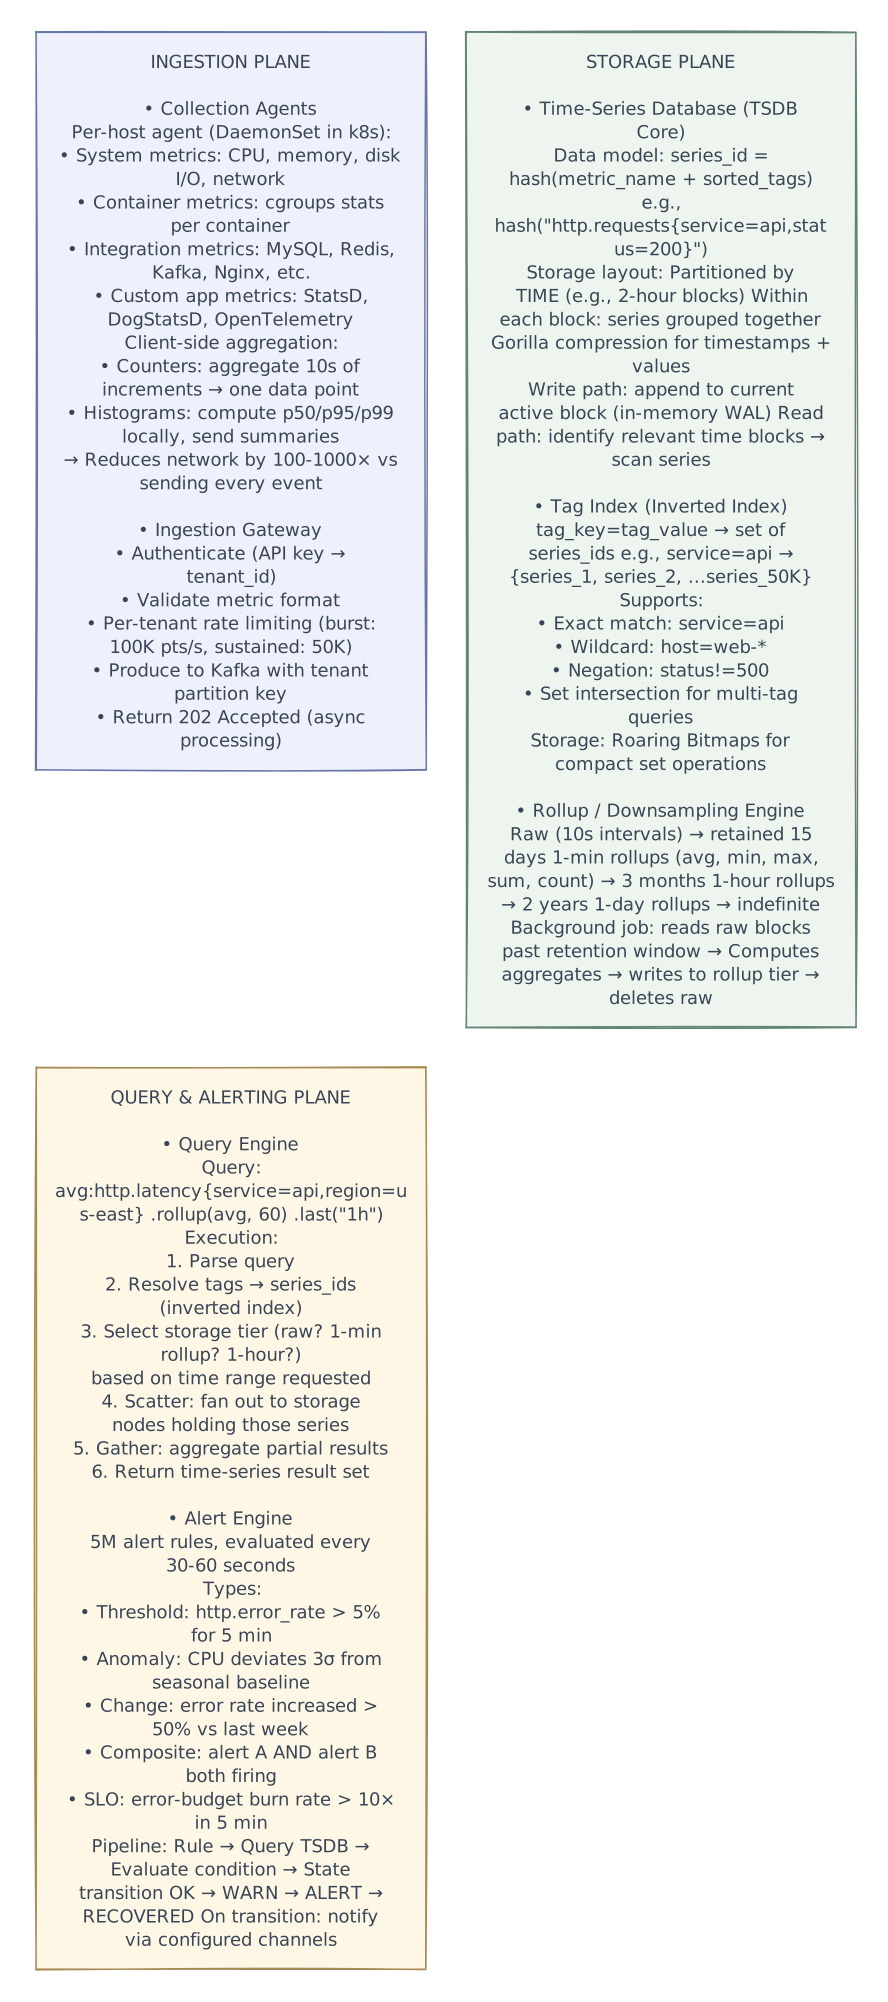
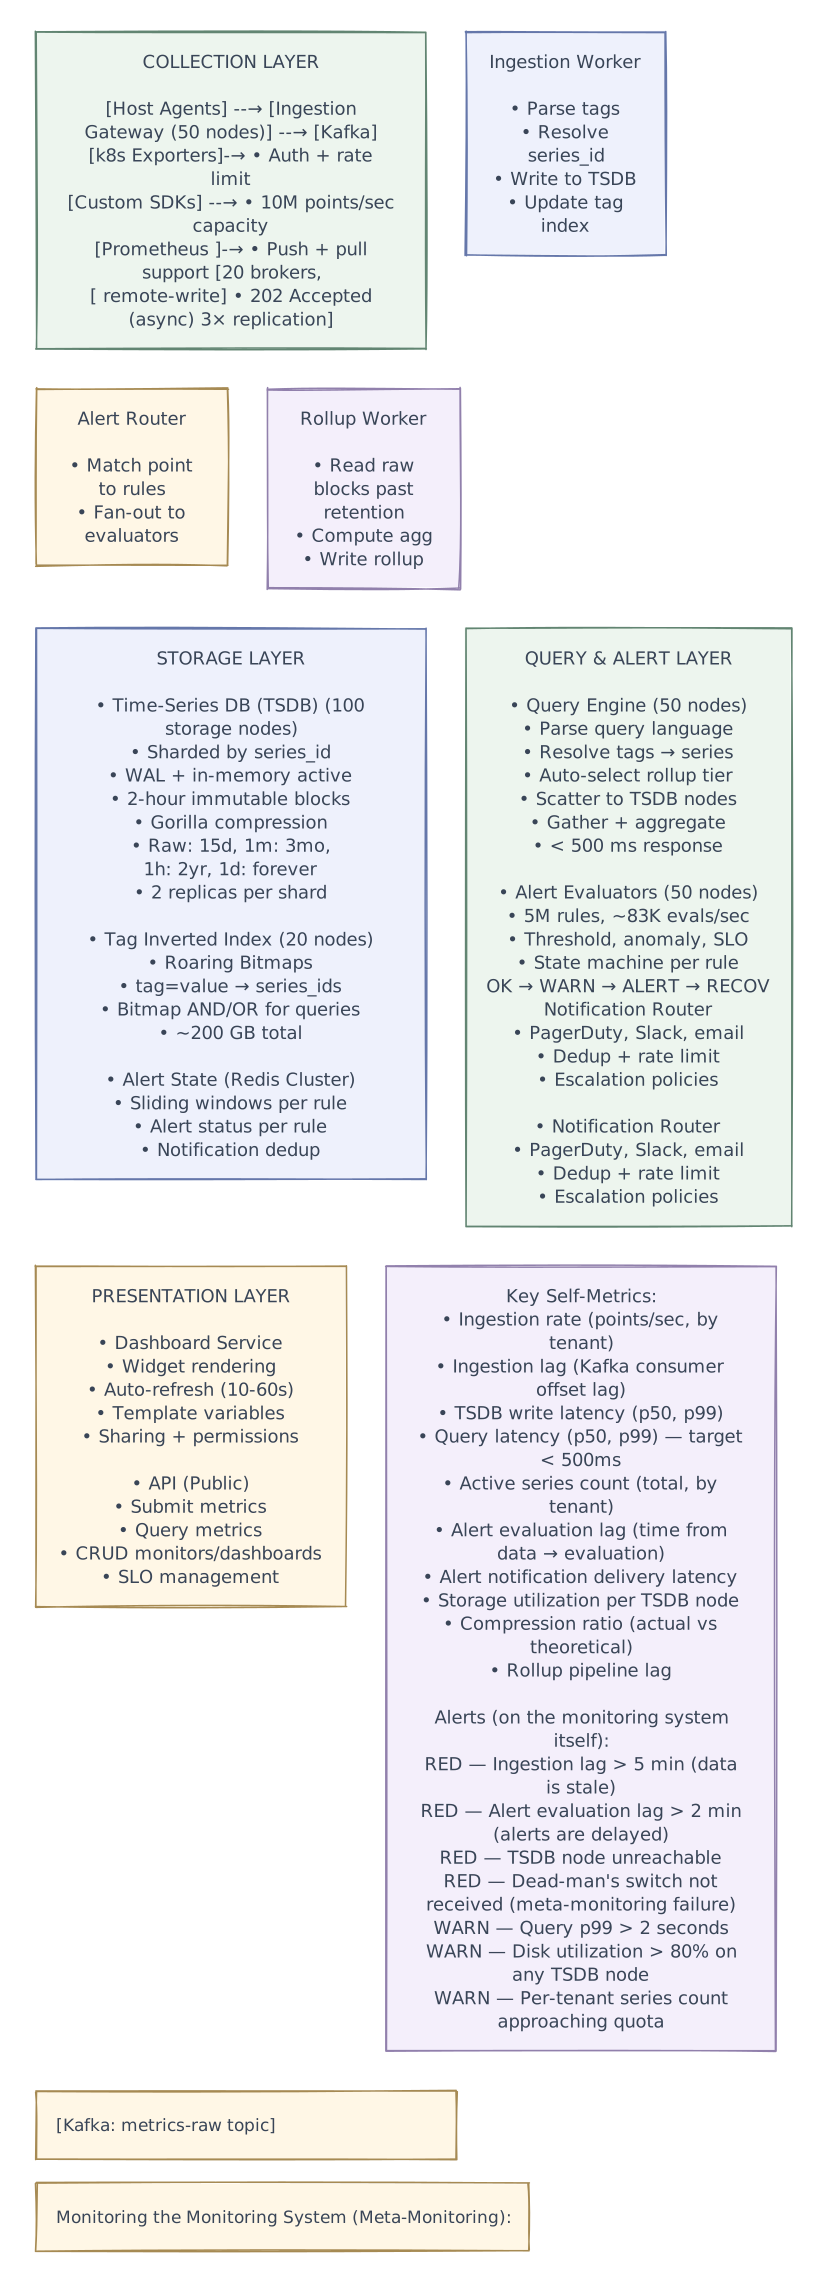
Full System Architecture (Production-Grade)

Further exploration
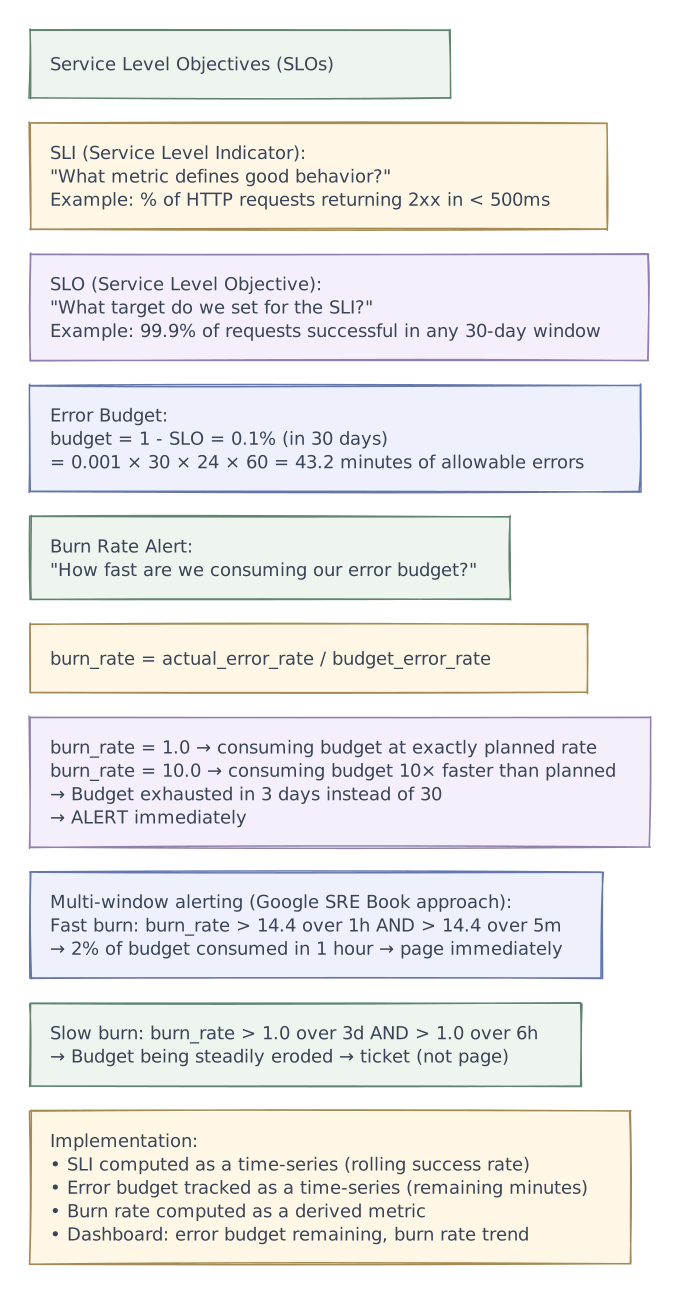
SLO Monitoring (Bonus Deep Dive)

Interview playbook
Interview Tips
Start with the write path — 10M points/sec — "Time-series is a write-dominated workload." Explain: agents batch + compress → push to ingestion gateway → Kafka buffer → ingestion workers → TSDB with WAL. Kafka decouples collection from storage and absorbs bursts.
Gorilla compression is the key insight — Don't just say "compress data." Explain: delta-of-delta for timestamps (1 bit for regular intervals), XOR for values (encode only changed bits). 1.37 bytes/point average = 11.7× compression. This is why a monitoring system storing 864B points/day needs only ~26 TB.
Time-partitioned blocks — 2-hour immutable blocks. Active block in memory (WAL for durability). Old blocks compressed, indexed, read-optimized on SSD. Deletion = drop a block file (instant, no GC). This is the Prometheus TSDB model.
Tag inverted index with Roaring Bitmaps — Query
service=api AND region=us-eastresolves to: bitmap A ∩ bitmap B = matching series IDs. Roaring Bitmaps are compact (~200 GB for 1B series) and support fast set operations. This is how tag-based queries stay fast.Rollup/downsampling is critical for long-term queries — Raw 10s data retained 15 days, 1-min rollups 3 months, 1-hour rollups 2 years. Query engine auto-selects the right tier based on time range. Transparent to the user. This is how a dashboard over "last 6 months" returns in < 500 ms.
Alert evaluation is streaming, not polling — 5M rules evaluated every 60s = 83K evals/sec. If each queries TSDB = overload. Instead: as data points arrive, route to matching alert rules (inverted index: metric+tags → rule_ids). Most data matches zero rules. Only evaluate relevant rules.
Multi-tenancy is about isolation — Per-tenant rate limits, series quotas, query timeouts. Cardinality explosion protection: if a tenant's metric has > 100K unique tag combinations, reject new series. One bad tenant must not affect others.
High-cardinality tags are the #1 operational issue — request_id, user_id, trace_id as tags = billions of unique series = storage explosion + slow queries. Detect + prevent at ingestion. This is the most common real-world problem in monitoring systems.
Meta-monitoring — who monitors the monitors? — Dead-man's switch: external service expects heartbeat every 5 min. If missing → alert via independent channel (SMS, not the monitoring system itself). If your monitoring is down, you're flying blind.
SLO burn-rate alerting shows depth — Don't just describe threshold alerts. Explain: SLI as a time-series, error budget calculation, burn rate = actual/budgeted error rate, multi-window alerting (fast burn pages, slow burn creates ticket). This is the Google SRE Book approach and demonstrates production maturity.